
Uncovering Networks in the US Congress 1947-2019
Overview
This was a final project output for our Network Science course under Prof. Erika Legara in the M.Sc. Data Science program. In this study, we examine the trend of partisanship in the US Congress over the past 72 years. Using a network approach, we look at the extent of polarity / cooperation of house and senate members across party lines. This was presented to class in March 2020.
A Network Analysis on Partisanship in Congressional Rollcall Votes
Summary
This work examines the widening partisan divide in the United States Congress using the framework of network science. By using the cosine similarity of members’ votes in rollcalls, their polarity from each other and the mangnitude of similarity can be determined. By looking at the intra-party and inter-party similarity scores of the different networks, we form a picture of the solidarity of each party and the cooperation across party lines throughout the duration of the data.
Dataset
The dataset was collected from the UCLA Department of Political Science’s Voteview initiative that tracks every Congressional rollcall votte in the history of the United States Congress. It contains information such as the members of both chambers of Congress for every Congress, the political affiliations of each member, and a record of every rollcall vote called along the votes of every member. The dataset is available here. Explanations are also available for every file: rollcall, votes, parties, and members
Preprocessing
We want to convert the data into a matrix such that:
- each row =
congressman - each column =
bill - values =
voteof that congressman for that bill- all positive votes will be 1 and all negative votes will be-1, everything else in NaN
A network for each chamber of congress (House and Senate) has to be constructed where the nodes represent each member and the edges tell how similarly each member votes with another member. The network is expected to be a fully connected network since an edge exists between all possible pairs of members. In this work, blue nodes are the Democrats, red nodes are the Republicans, and gray nodes are other parties.
Packages and Libraries
import networkx as nx
import community
from sklearn.metrics.pairwise import cosine_similarity
from scipy.spatial.distance import euclidean, cosine
from scipy.stats import zscore, kurtosis
Convert to Network structure using Congress Class
But first, we define helper functions to create an adjacency matrix containing the cosine similarity score between members of congress.
def create_cos_matrix(data):
    try:
        df = data.to_numpy().copy()
    except:
        df = data.copy()

    df2 = df.copy()
    tally = np.zeros((df.shape[0], df.shape[0]))
    tally_sim = np.zeros((df.shape[0], df.shape[0]))
    tally_count = np.zeros((df.shape[0], df.shape[0]))

    for i in range(len(df)):
        df[i] = df[i] - df[i][~np.isnan(df[i])].mean()

    for i in tqdm(range(df.shape[0])):

        for j in range(df.shape[0]):

            if i==j:
                tally[i,j] = 0
                tally_sim[i,j] = 0
                tally_count[i,j] = 1

            else:
                indexer = ~np.isnan(df[i]) & ~np.isnan(df[j])
                tally_count[i,j] = (df2[i][indexer] == df2[j][indexer]).sum()/indexer.sum()

                if (indexer*1).sum() == 1:
                    tally[i,j] = 0
                    tally_sim[i,j] = 0
                else:
                    tally[i,j] = cosine(df[i][indexer], df[j][indexer])
                    try:
                        tally_sim[i,j] = cosine_similarity(df[i][indexer].reshape(1,-1), df[j][indexer].reshape(1,-1))[0,0]
                    except ValueError:
                        tally_sim[i,j] = np.nan

    return tally, tally_sim, tally_count
def clean_network(G):
    for u in G.nodes:
        for v in G.nodes:
            try:
                if u == v:
                    pass
                elif np.isnan(G[u][v]['costdist']):
                    G.remove_edge(u,v)
            except KeyError:
                pass
    return G
To detemine the edge weights, we look at the cosine similarity of the voting pattern of each member of congress against another member. This enables us to actually identify the directionality of the connection - whether it’s positive or negative. Then we feed it to the package networkx to create the fully connected undirected network representation of the voting patterns of a given Congress. This is repeated for each chamber of the 80th - 115th Congresses.
class Congress():
    def __init__(self, congress_num):
        self.congress = congress_num

        Gs = []
        dem_nodes = []
        rep_nodes = []
        for chamber in ['Senate', 'House']:
            df = votes[(votes['congress']==congress_num) & (votes['chamber']==chamber)]
            converter = person_converter(df)
            inv_personconverter = {v:k for k,v in converter.items()}

            df = df.merge(members[['congress', 'icpsr', 'party_code']], on=['congress', 'icpsr'])
            df['vote'] = df['cast_code'].map(vote_converter)
            df['person'] = df['icpsr'].map(converter)
            df['party_color'] = df['party_code'].map(party_color)
            df['party'] = df['party_code'].map({100:'dem', 200:'rep'})

            party_converter = dict(zip(df['person'].to_list(), df['party'].to_list()))
            party_color_converter = dict(zip(df['person'].to_list(), df['party_color'].to_list()))

            df = df.pivot_table(values='vote', index='person', columns='rollnumber').to_numpy()

            cosdis_df, cossim_df, count_df = create_cos_matrix(df)

            combs = combinations([i for i in range(len(cosdis_df))], 2)

            dataframe_list = []

            for comb in combs:
                dataframe_list.append((comb[0], comb[1], cosdis_df[comb[0], comb[1]], \
                                       cossim_df[comb[0], comb[1]], count_df[comb[0], comb[1]]))

            net_df = pd.DataFrame(dataframe_list, columns=['name1', 'name2', 'cosdist', 'cossim', 'agreement'])

            G = clean_network(nx.from_pandas_edgelist(net_df, 'name1', 'name2', ['cosdist', 'cossim', 'agreement']))

            nx.set_node_attributes(G, party_converter, 'party')
            nx.set_node_attributes(G, party_color_converter, 'party_color')
            nx.set_node_attributes(G, inv_personconverter, 'icpsr')

            Gs.append(G)
            dem_nodes.append([k for k,v in party_converter.items() if v == 'dem'])
            rep_nodes.append([k for k,v in party_converter.items() if v == 'rep'])

        self.house = Gs[1]
        self.senate = Gs[0]
        self.senate_dem_nodes = dem_nodes[0]
        self.senate_rep_nodes = rep_nodes[0]
        self.house_dem_nodes = dem_nodes[1]
        self.house_rep_nodes = rep_nodes[1]
        self.house_majority = house_majority[congress_num] if congress_num in house_majority.keys() else 'No data'
        self.senate_majority = sen_majority[congress_num] if congress_num in sen_majority.keys() else 'No data'

    def get_subgraph(self, chamber, party):
        graph_to_subset = self.senate if chamber.lower() == 'senate' else self.house
        rep_dict = {'senate_dem':self.senate_dem_nodes, 'senate_rep':self.senate_rep_nodes,
                    'house_dem':self.house_dem_nodes, 'house_rep':self.house_rep_nodes}
        to_subset = rep_dict[chamber.lower()+'_'+party]
        return nx.subgraph(graph_to_subset, to_subset)
Get all congresses:
net = {}
for congress in tqdm(range(80,116)):
    net[congress] = Congress(congress)
We need to remove the edges that are NaN.
for i in tqdm(range(80,116)):
    for node in net[i].senate.nodes:
        for k, v in dict(net[i].senate[node]).items():
            if np.isnan(v['cosdist']):
                net[i].senate.remove_edge(node, k)
    for node in net[i].house.nodes:
        for k, v in dict(net[i].house[node]).items():
            if np.isnan(v['cosdist']):
                net[i].house.remove_edge(node, k)
Average Cosine Similarity Over Time (House and Senate)
By looking at the average degree of each network, we are effectively looking at how similar the voting patterns are of each party in both the House and Senate chambers of Congress. This tells us how similar persons in the same political party vote with regard to rollcalls.
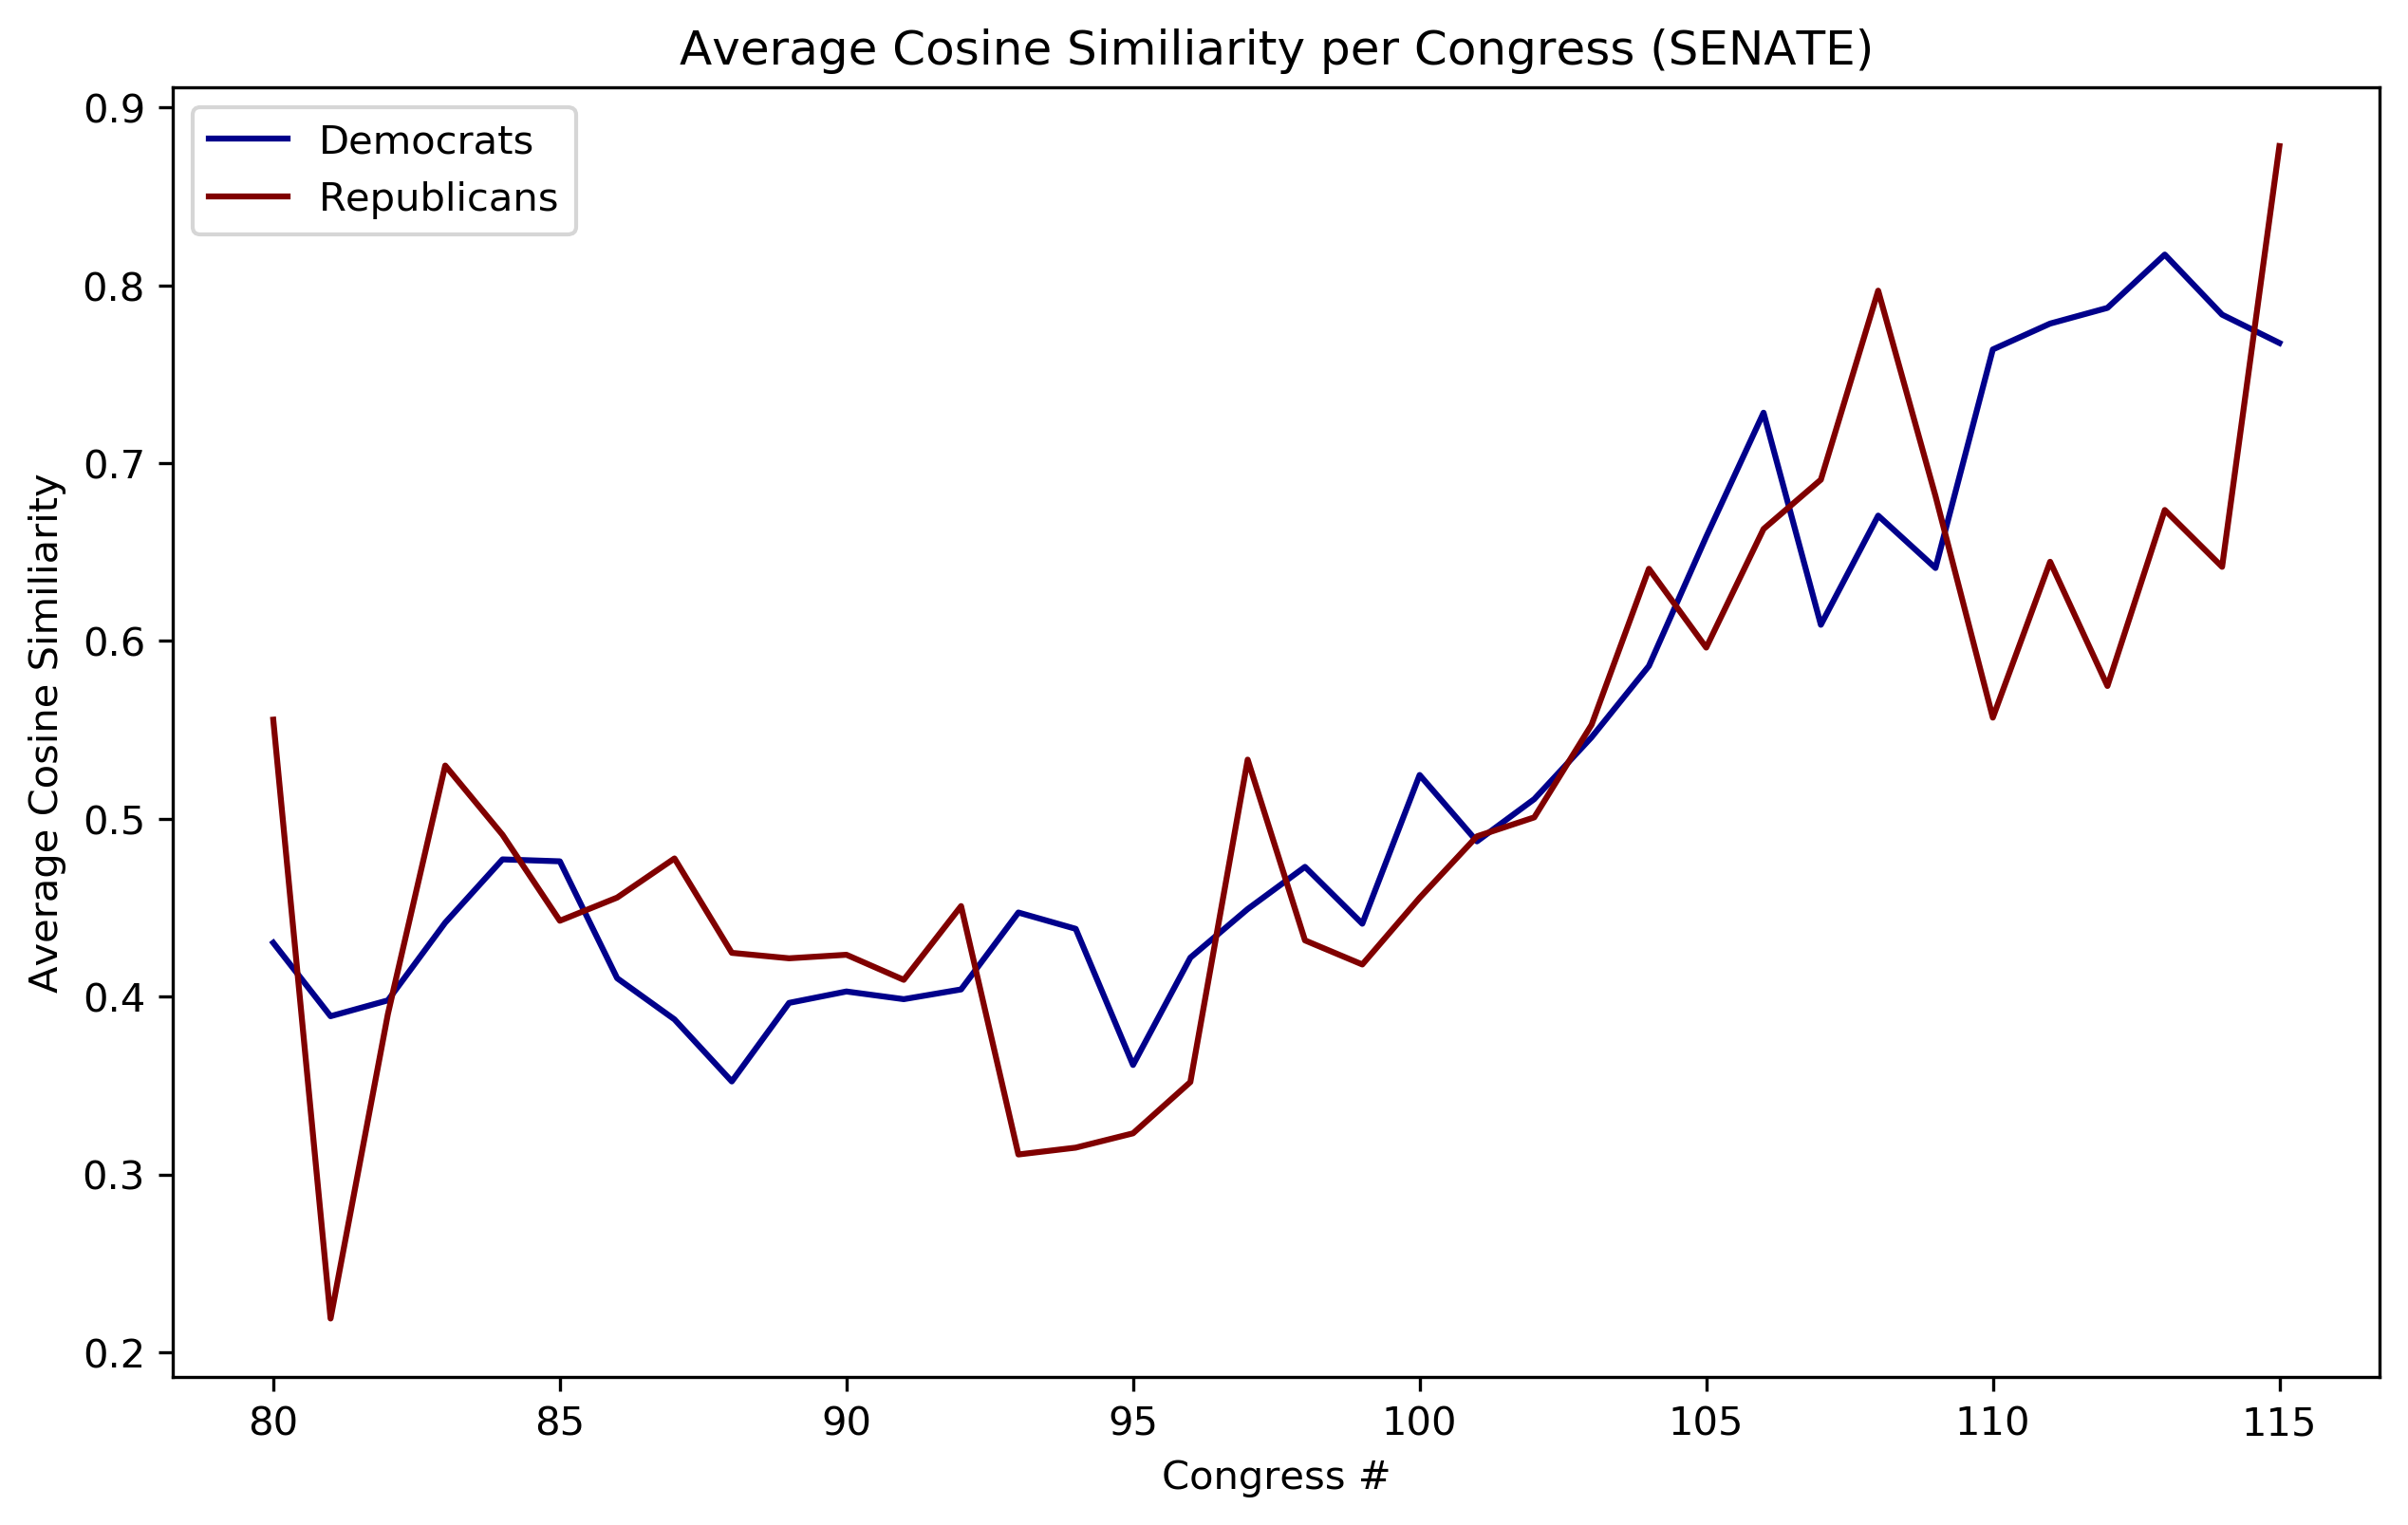
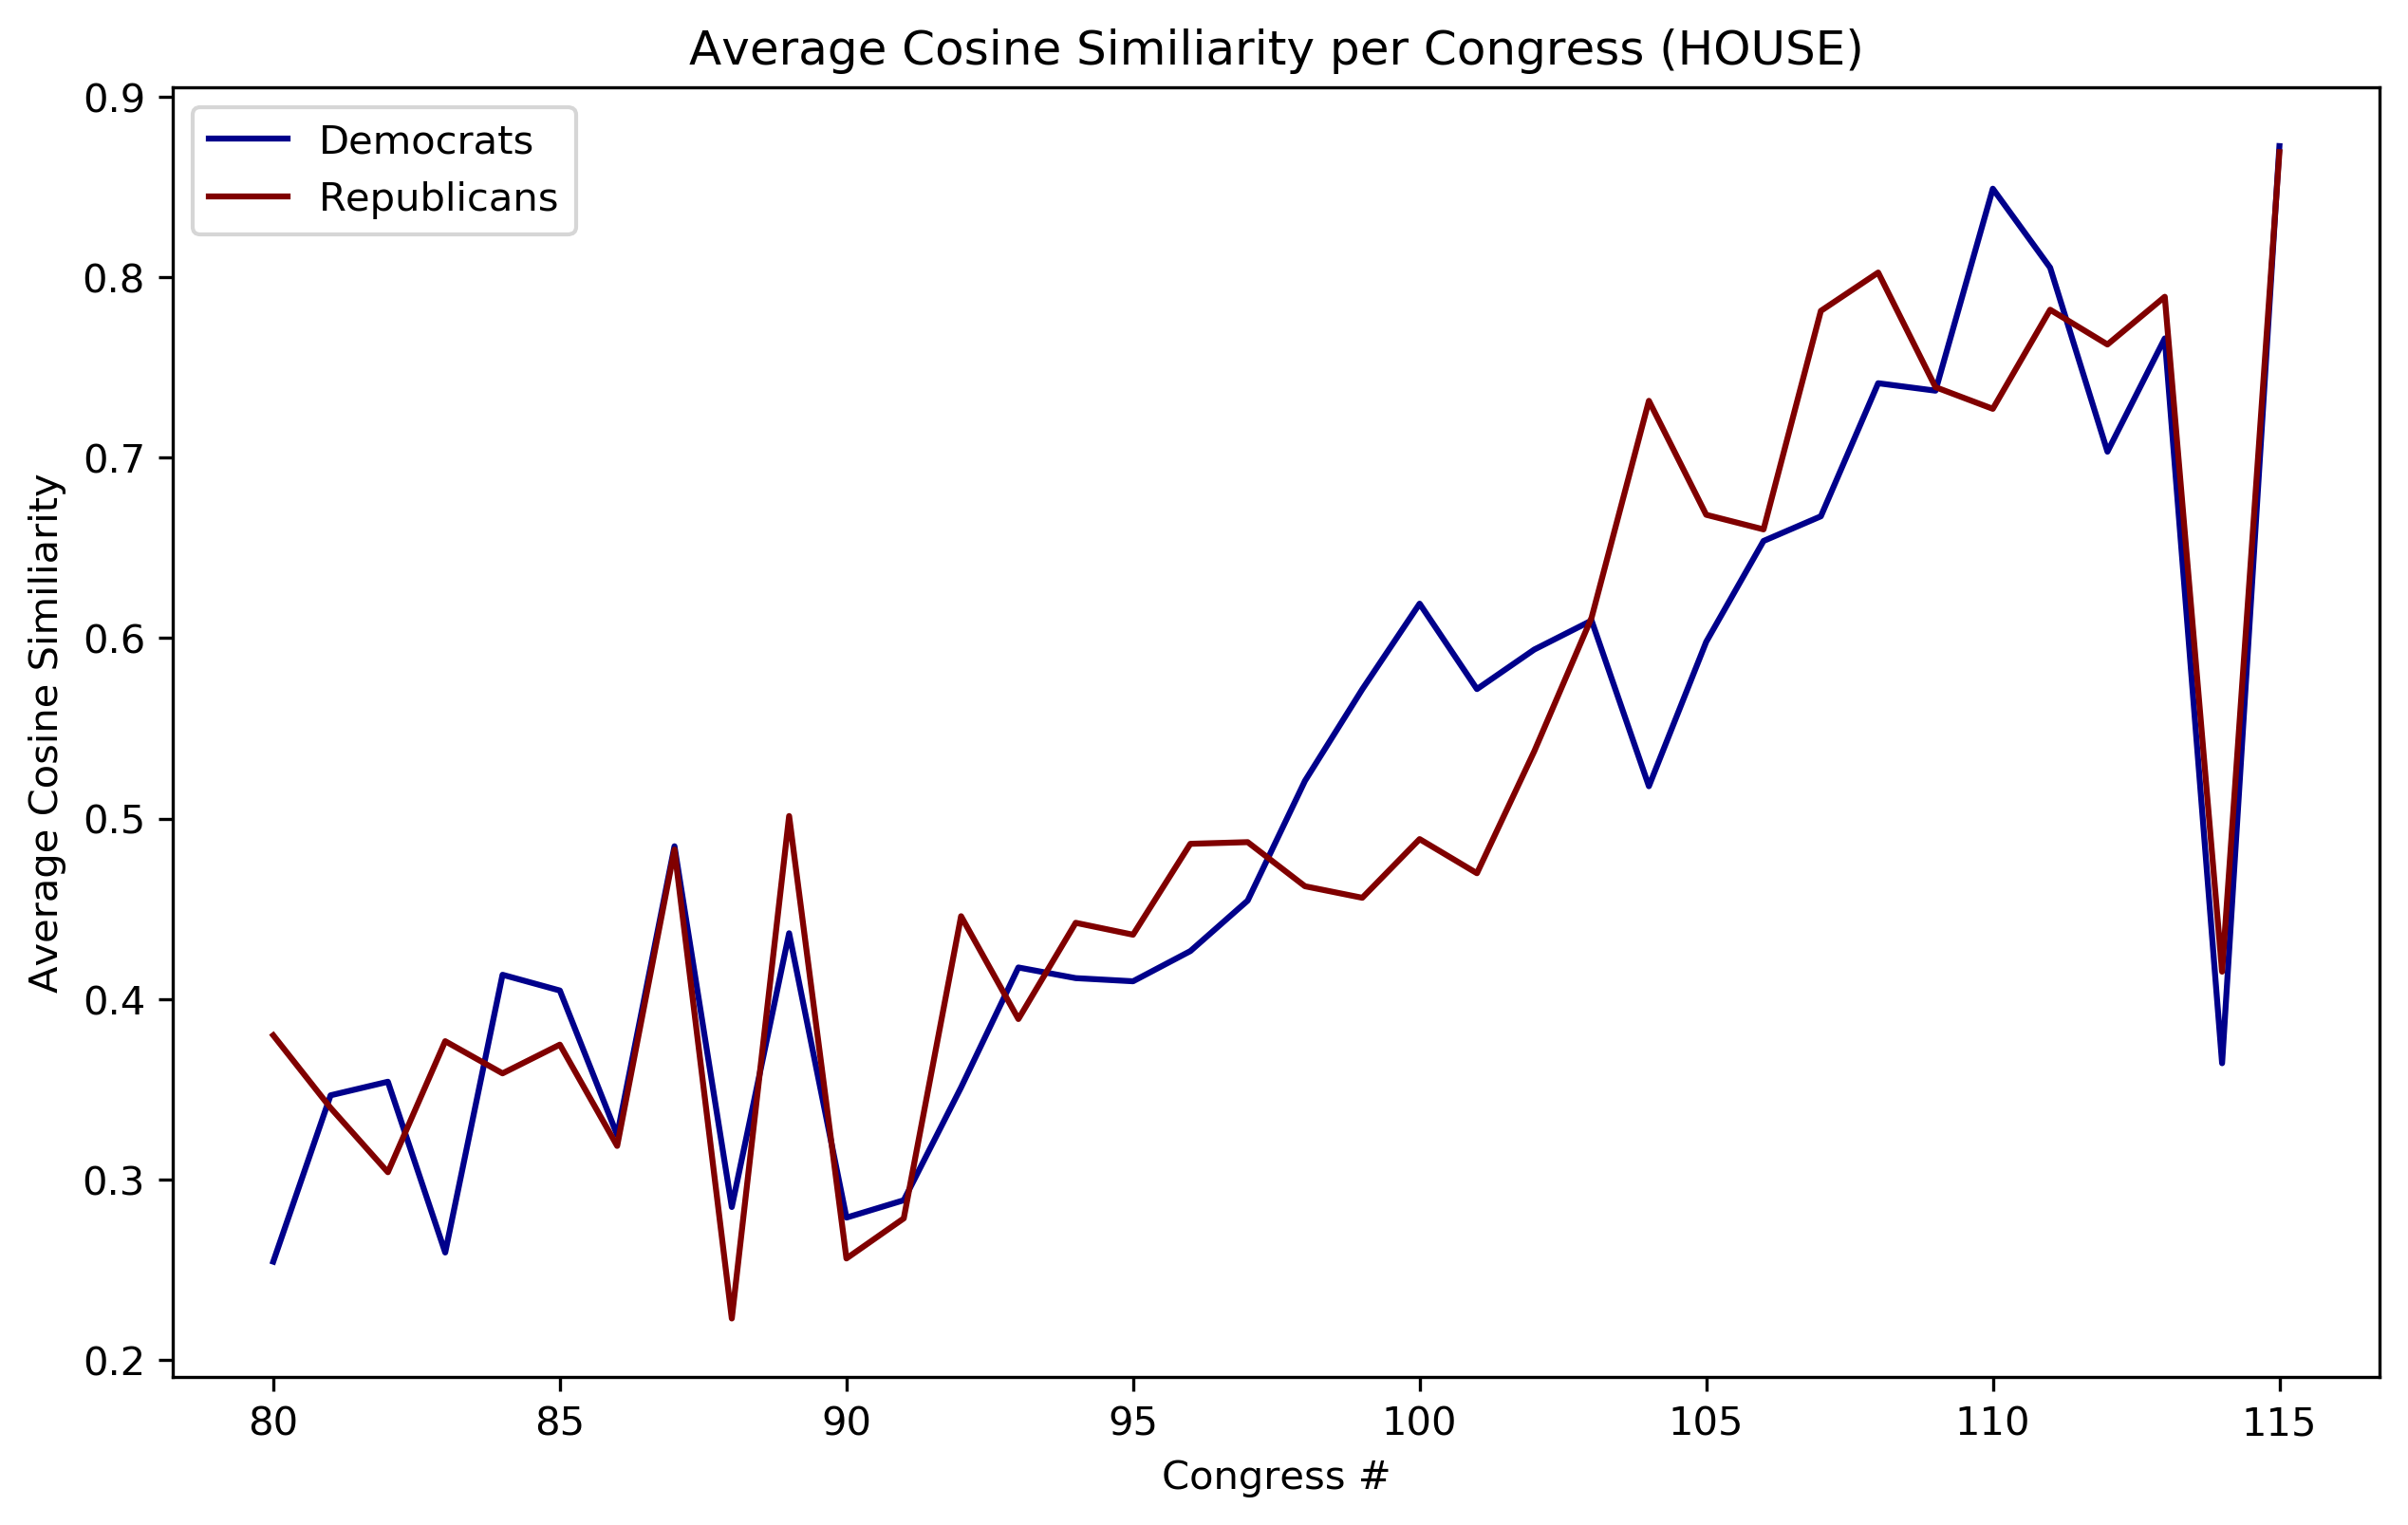
We can observe a general uptrend in the average similarity of voting patterns with occasional spikes and declines. The largest drop can be in the 114th Congress which was the last years of Obama’s administration.
Cooperation between parties
This is measured by getting the average cosine distance between each member of one party against each member of the opposing party. Do this for all members of the first party, and get the average. It represents the level of agreement or bipartisanship that exists in both chambers.
def get_cooperation(G, chamber, weight='cosdist'):

    if chamber.lower() == 'senate':
        reps = G.senate_rep_nodes
        dems = G.senate_dem_nodes
        G = G.senate
    else:
        reps = G.house_rep_nodes
        dems = G.house_dem_nodes
        G = G.house

    scores = []

    for rep in reps:
        for dem in dems:
            try:
                scores.append(G[rep][dem][weight])
            except KeyError:
                pass

    return np.nanmean(scores)
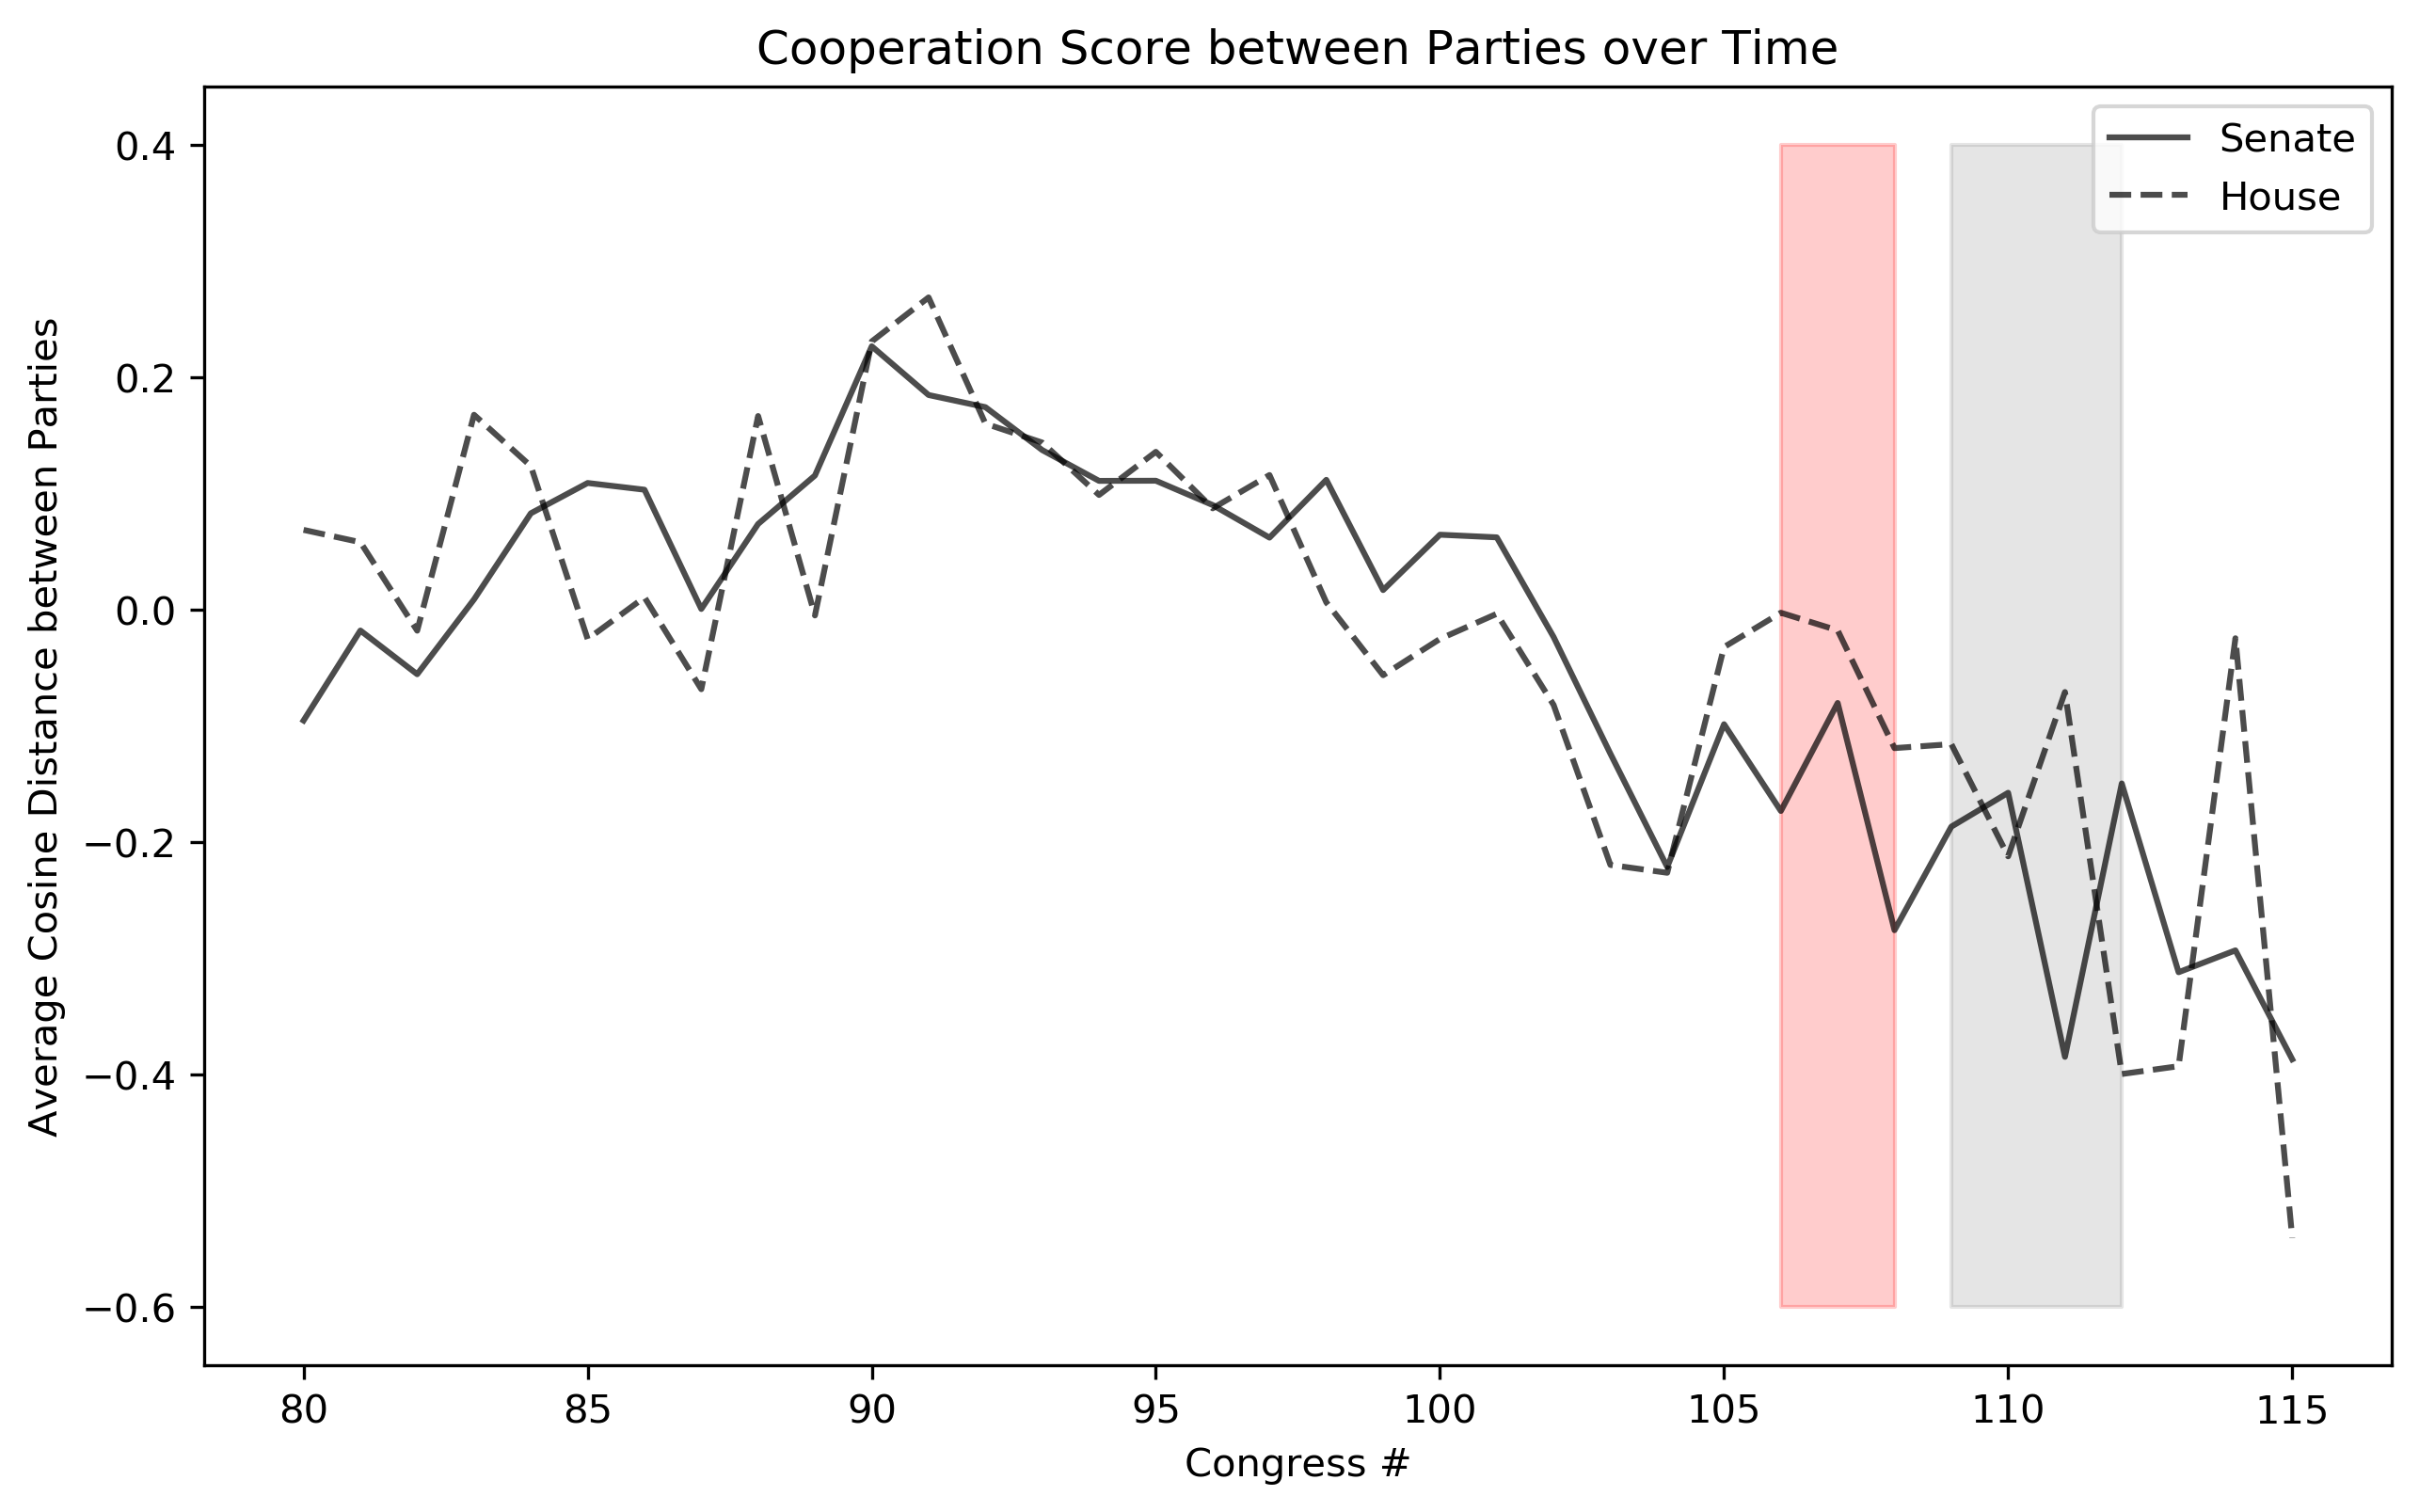
We can see a downward trend in contrast to the similarity score. Expectedly, a higher intra-party similarity (partisan voting) leads to lower inter-party similarity (bipartisan voting). The highlight in red shows the period of the Iraq war while the highlight in gray shows the globan financial crisis.
Finding the largest difference (delta) in cooperation in Congress
Which congress had the largest rise/fall in terms of partisanship?
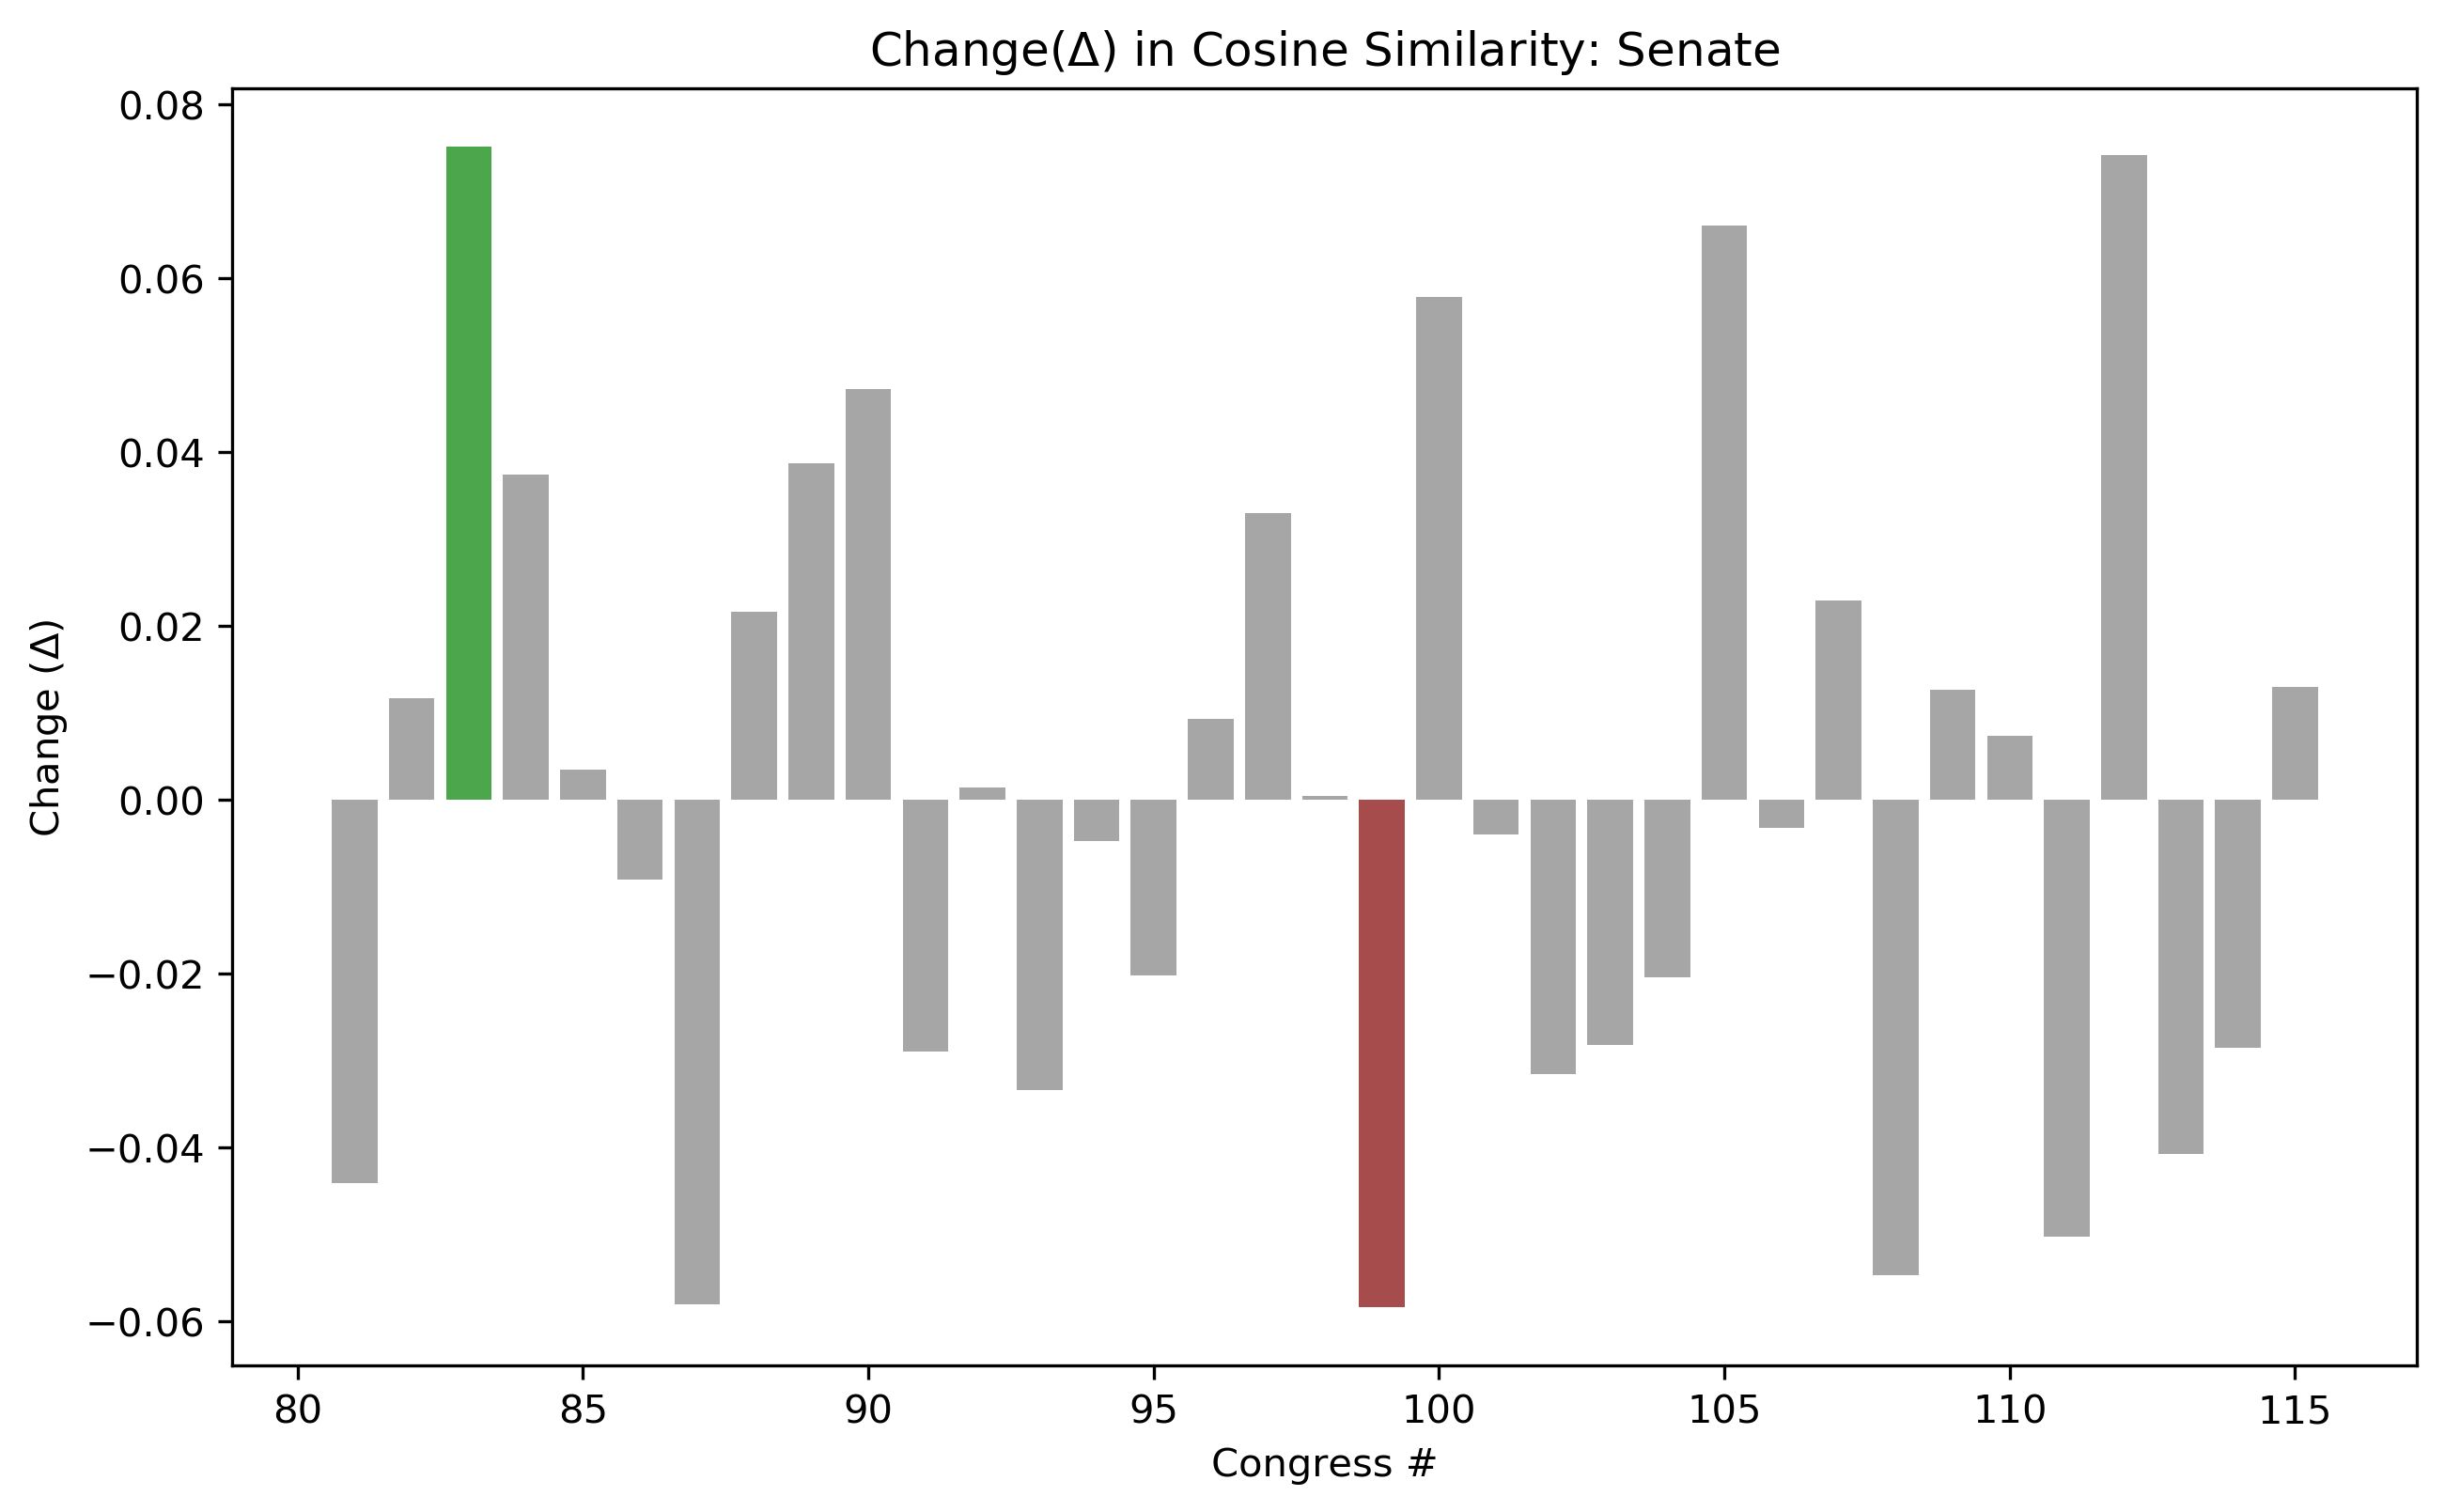
We also looked at the change in cooperation score, specifically the direction and magnitude of change between two congresses.
house_cossim, senate_cossim = [], []

for congress in tqdm(range(80, 116)):
    senate_cossim.append(get_average_edges(net[congress].senate, 'cossim'))
    house_cossim.append(get_average_edges(net[congress].house, 'cossim'))
senate_cossim_colors = ['grey' if i < np.max(np.diff([np.nanmean([j[1] for j in i]) for i in senate_cossim])) \
                       else 'green' for i in np.diff([np.nanmean([j[1] for j in i]) for i in senate_cossim])]
senate_cossim_colors[np.argmin(np.diff([np.nanmean([j[1] for j in i]) for i in senate_cossim]))] = 'maroon'
house_cossim_colors = ['grey' if i < np.max(np.diff([np.nanmean([j[1] for j in i]) for i in house_cossim])) \
                       else 'green' for i in np.diff([np.nanmean([j[1] for j in i]) for i in house_cossim])]
house_cossim_colors[np.argmin(np.diff([np.nanmean([j[1] for j in i]) for i in house_cossim]))] = 'maroon'
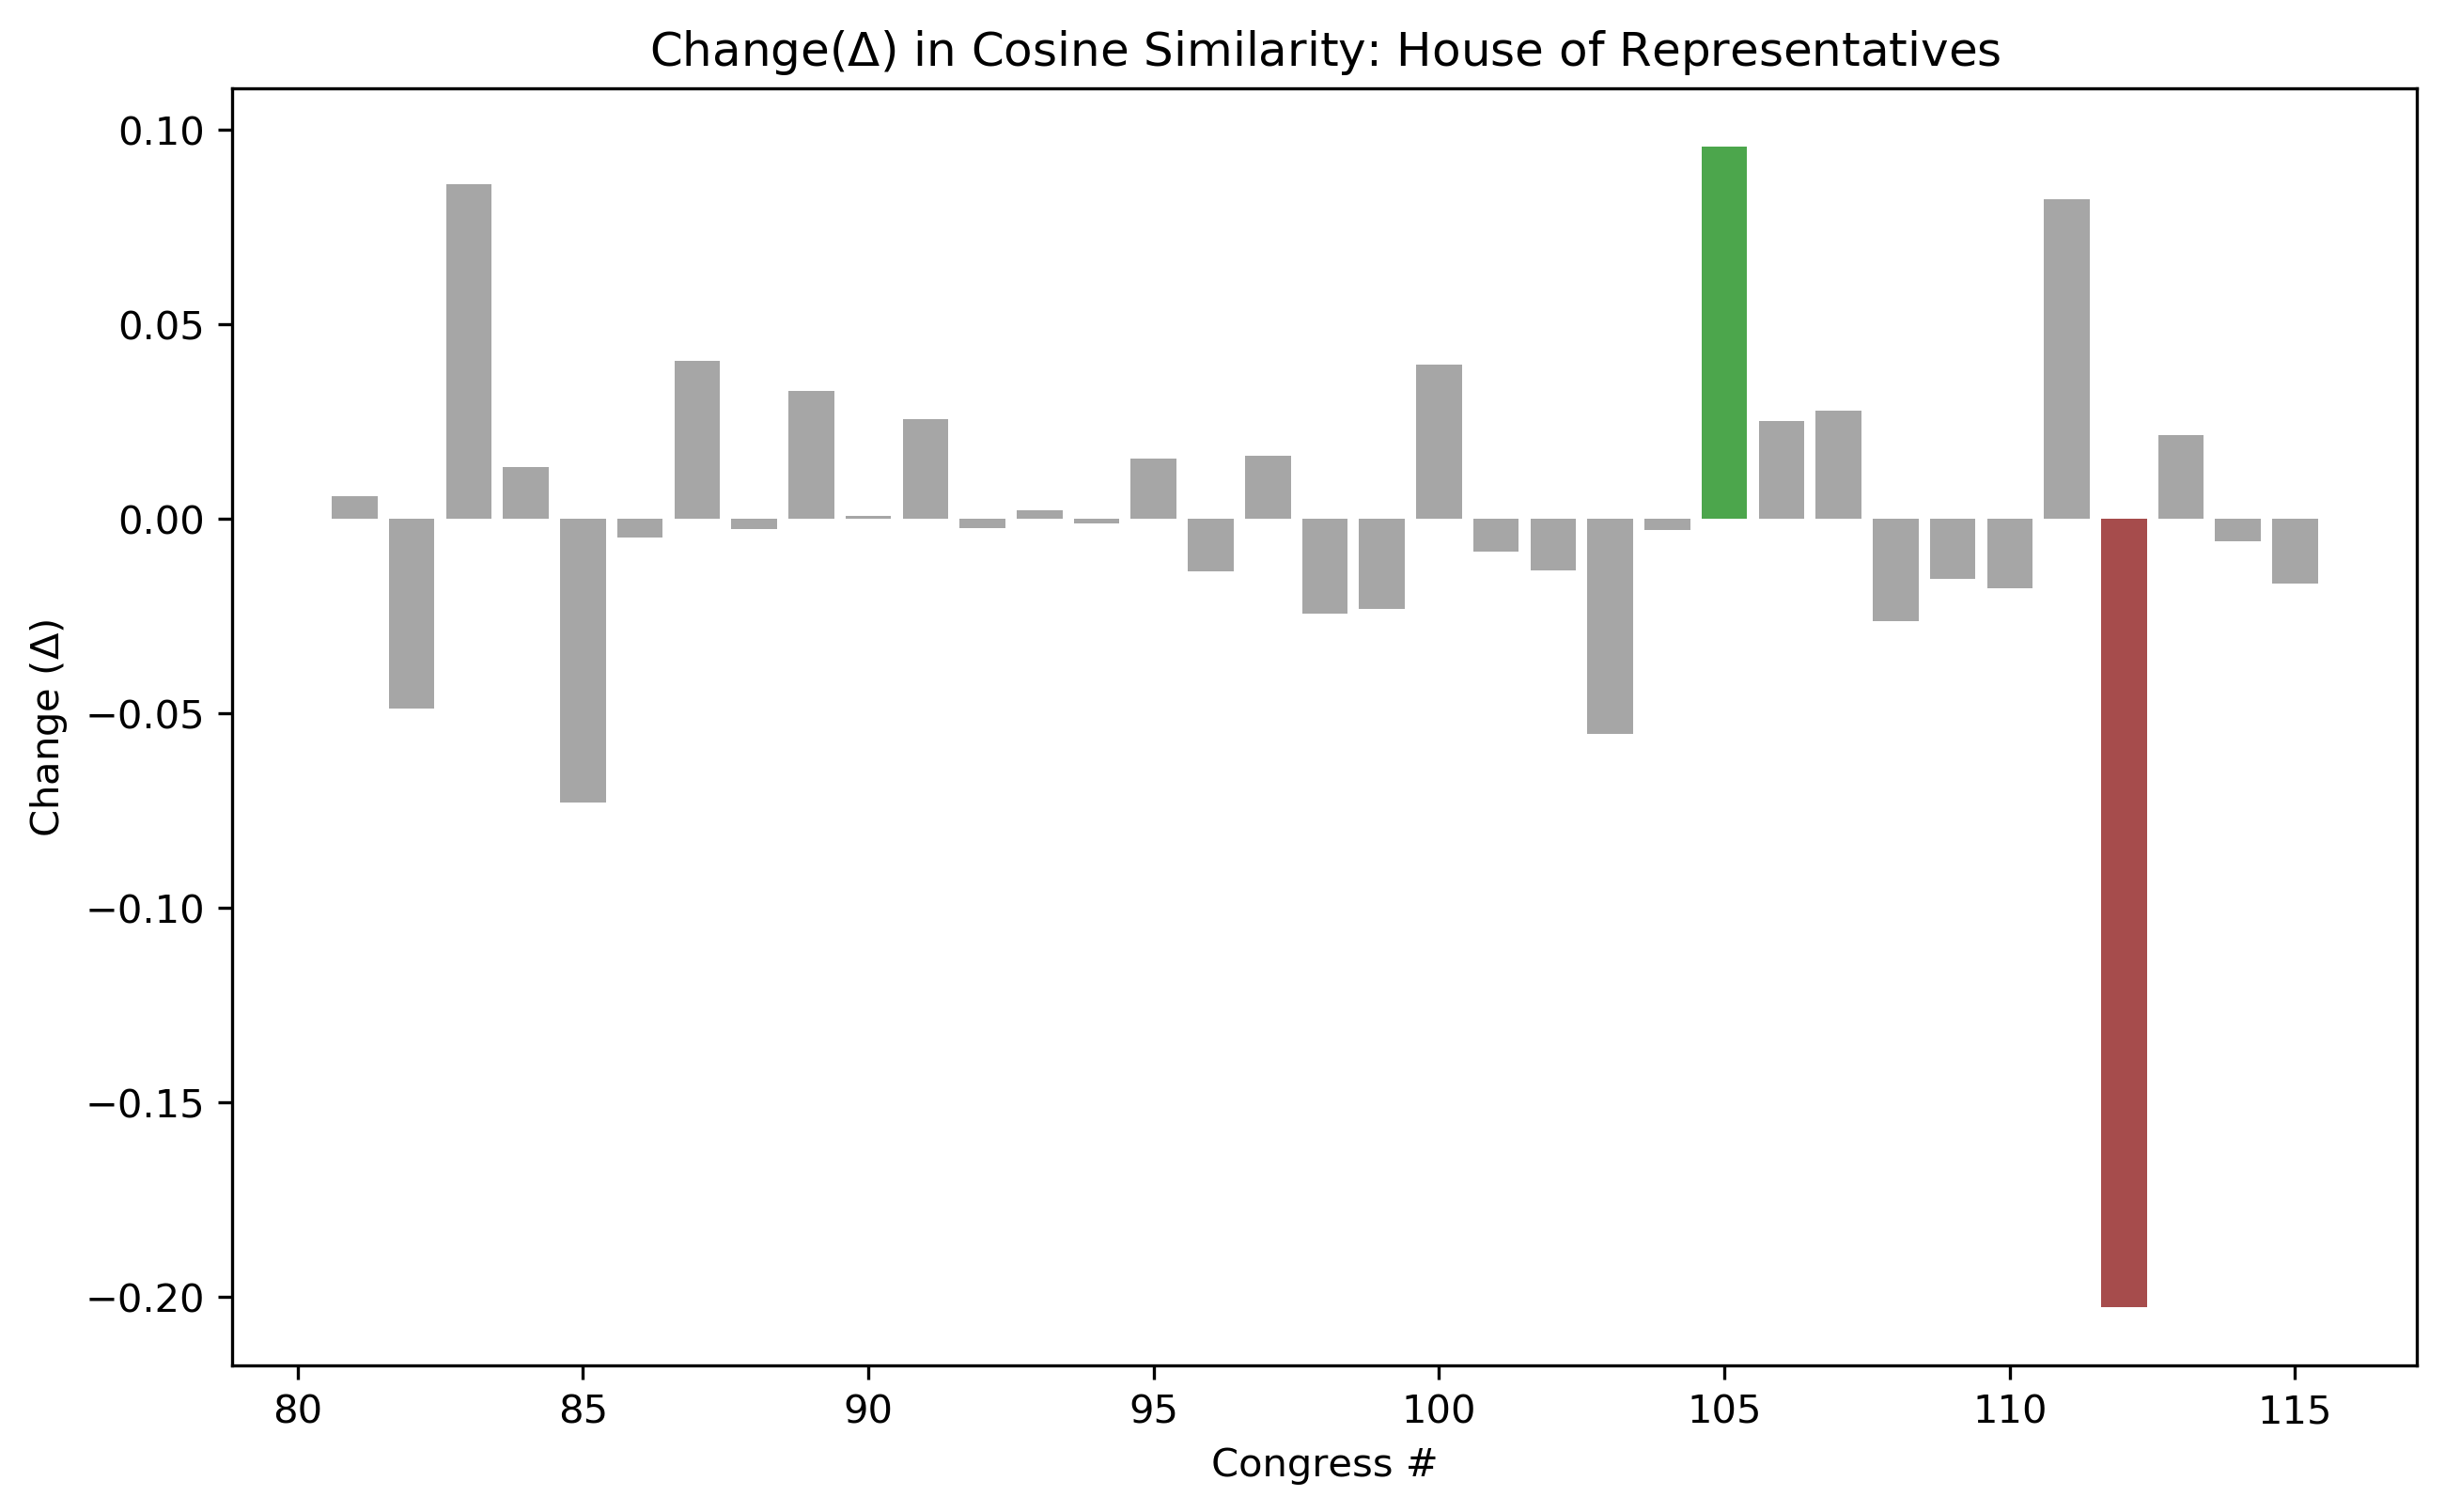
We can see that during the 111th-112th Congress, the Senate experienced its second-highest positive change in magnitude of cooperation score, indicating that the Senate chamber voted more in line with their party as compared to the 111th Congress. On the other hand, the House of Representatives experienced the largest negative change in similarity during this period. This indicates that the 112th Congress was vastly more bipartisan than the 111th Congress.
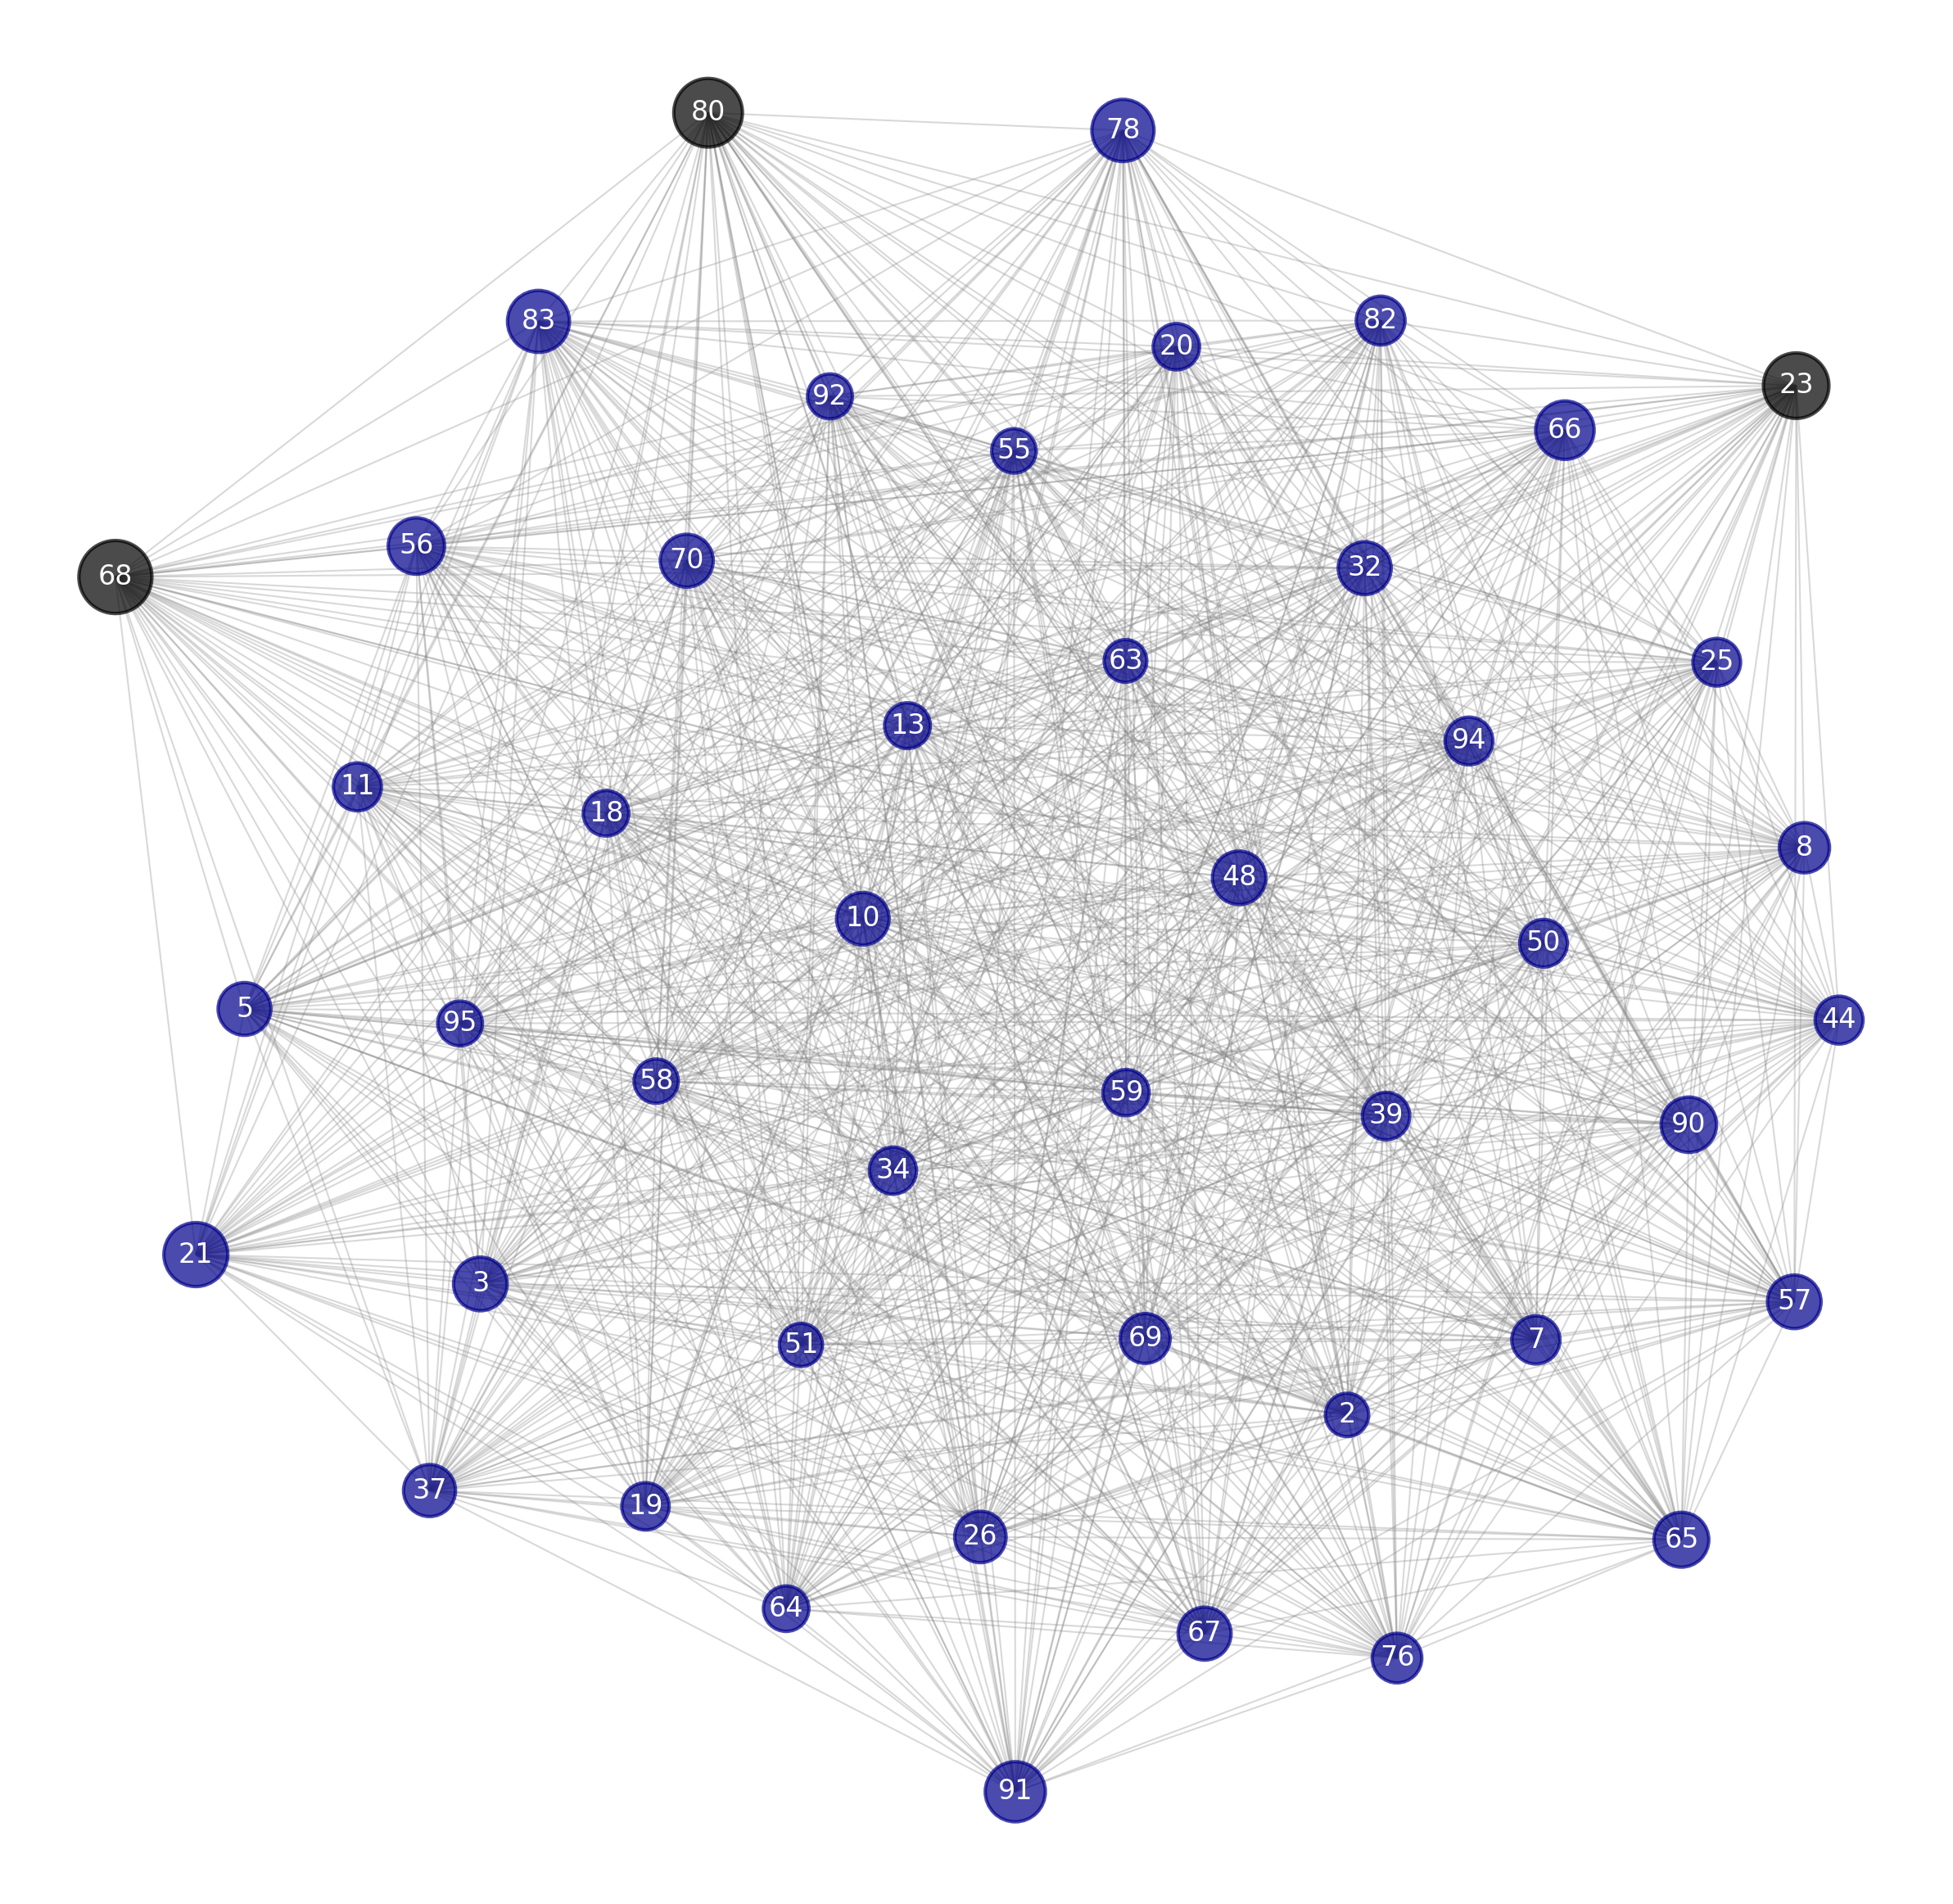
Outliers
Using the network degrees, we can also take a look at the outliers for each chamber over time. Outliers are defined as being 2 standard deviations away from the mean cosine similarity of a given congress. Looking at the outliers,we can identify those members of congress that are not fully aligned with their respective political parties.
def get_average_edges(G, weight='cosdist'):
    return [(i, np.nanmean([v[weight] for k,v in dict(G[i]).items()])) \
            for i in G.nodes]
def get_outliers(G, threshold=2):
    return np.array(G.nodes)[zscore([i[1] for i \
        in get_average_edges(G, 'cosdist')]) > threshold]
G = net[115].get_subgraph('senate', 'dem')
node_colors = ['darkblue' if node not in get_outliers(G) else 'black' for node in G.nodes]
pos = nx.fruchterman_reingold_layout(G, weight='cossim')
fig, ax = plt.subplots(dpi=300, figsize=(10,10))
ax.axis('off')
nx.draw_networkx_nodes(G, pos, node_size=[np.nanmean([v['cosdist']*1000 for k,v in dict(G[node]).items()]) for node in G.nodes], node_color=node_colors, alpha=0.7);
nx.draw_networkx_edges(G, pos, alpha=0.3, edge_color='gray', width=0.5);

nx.draw_networkx_labels(G, pos, font_color="white", font_size=8);
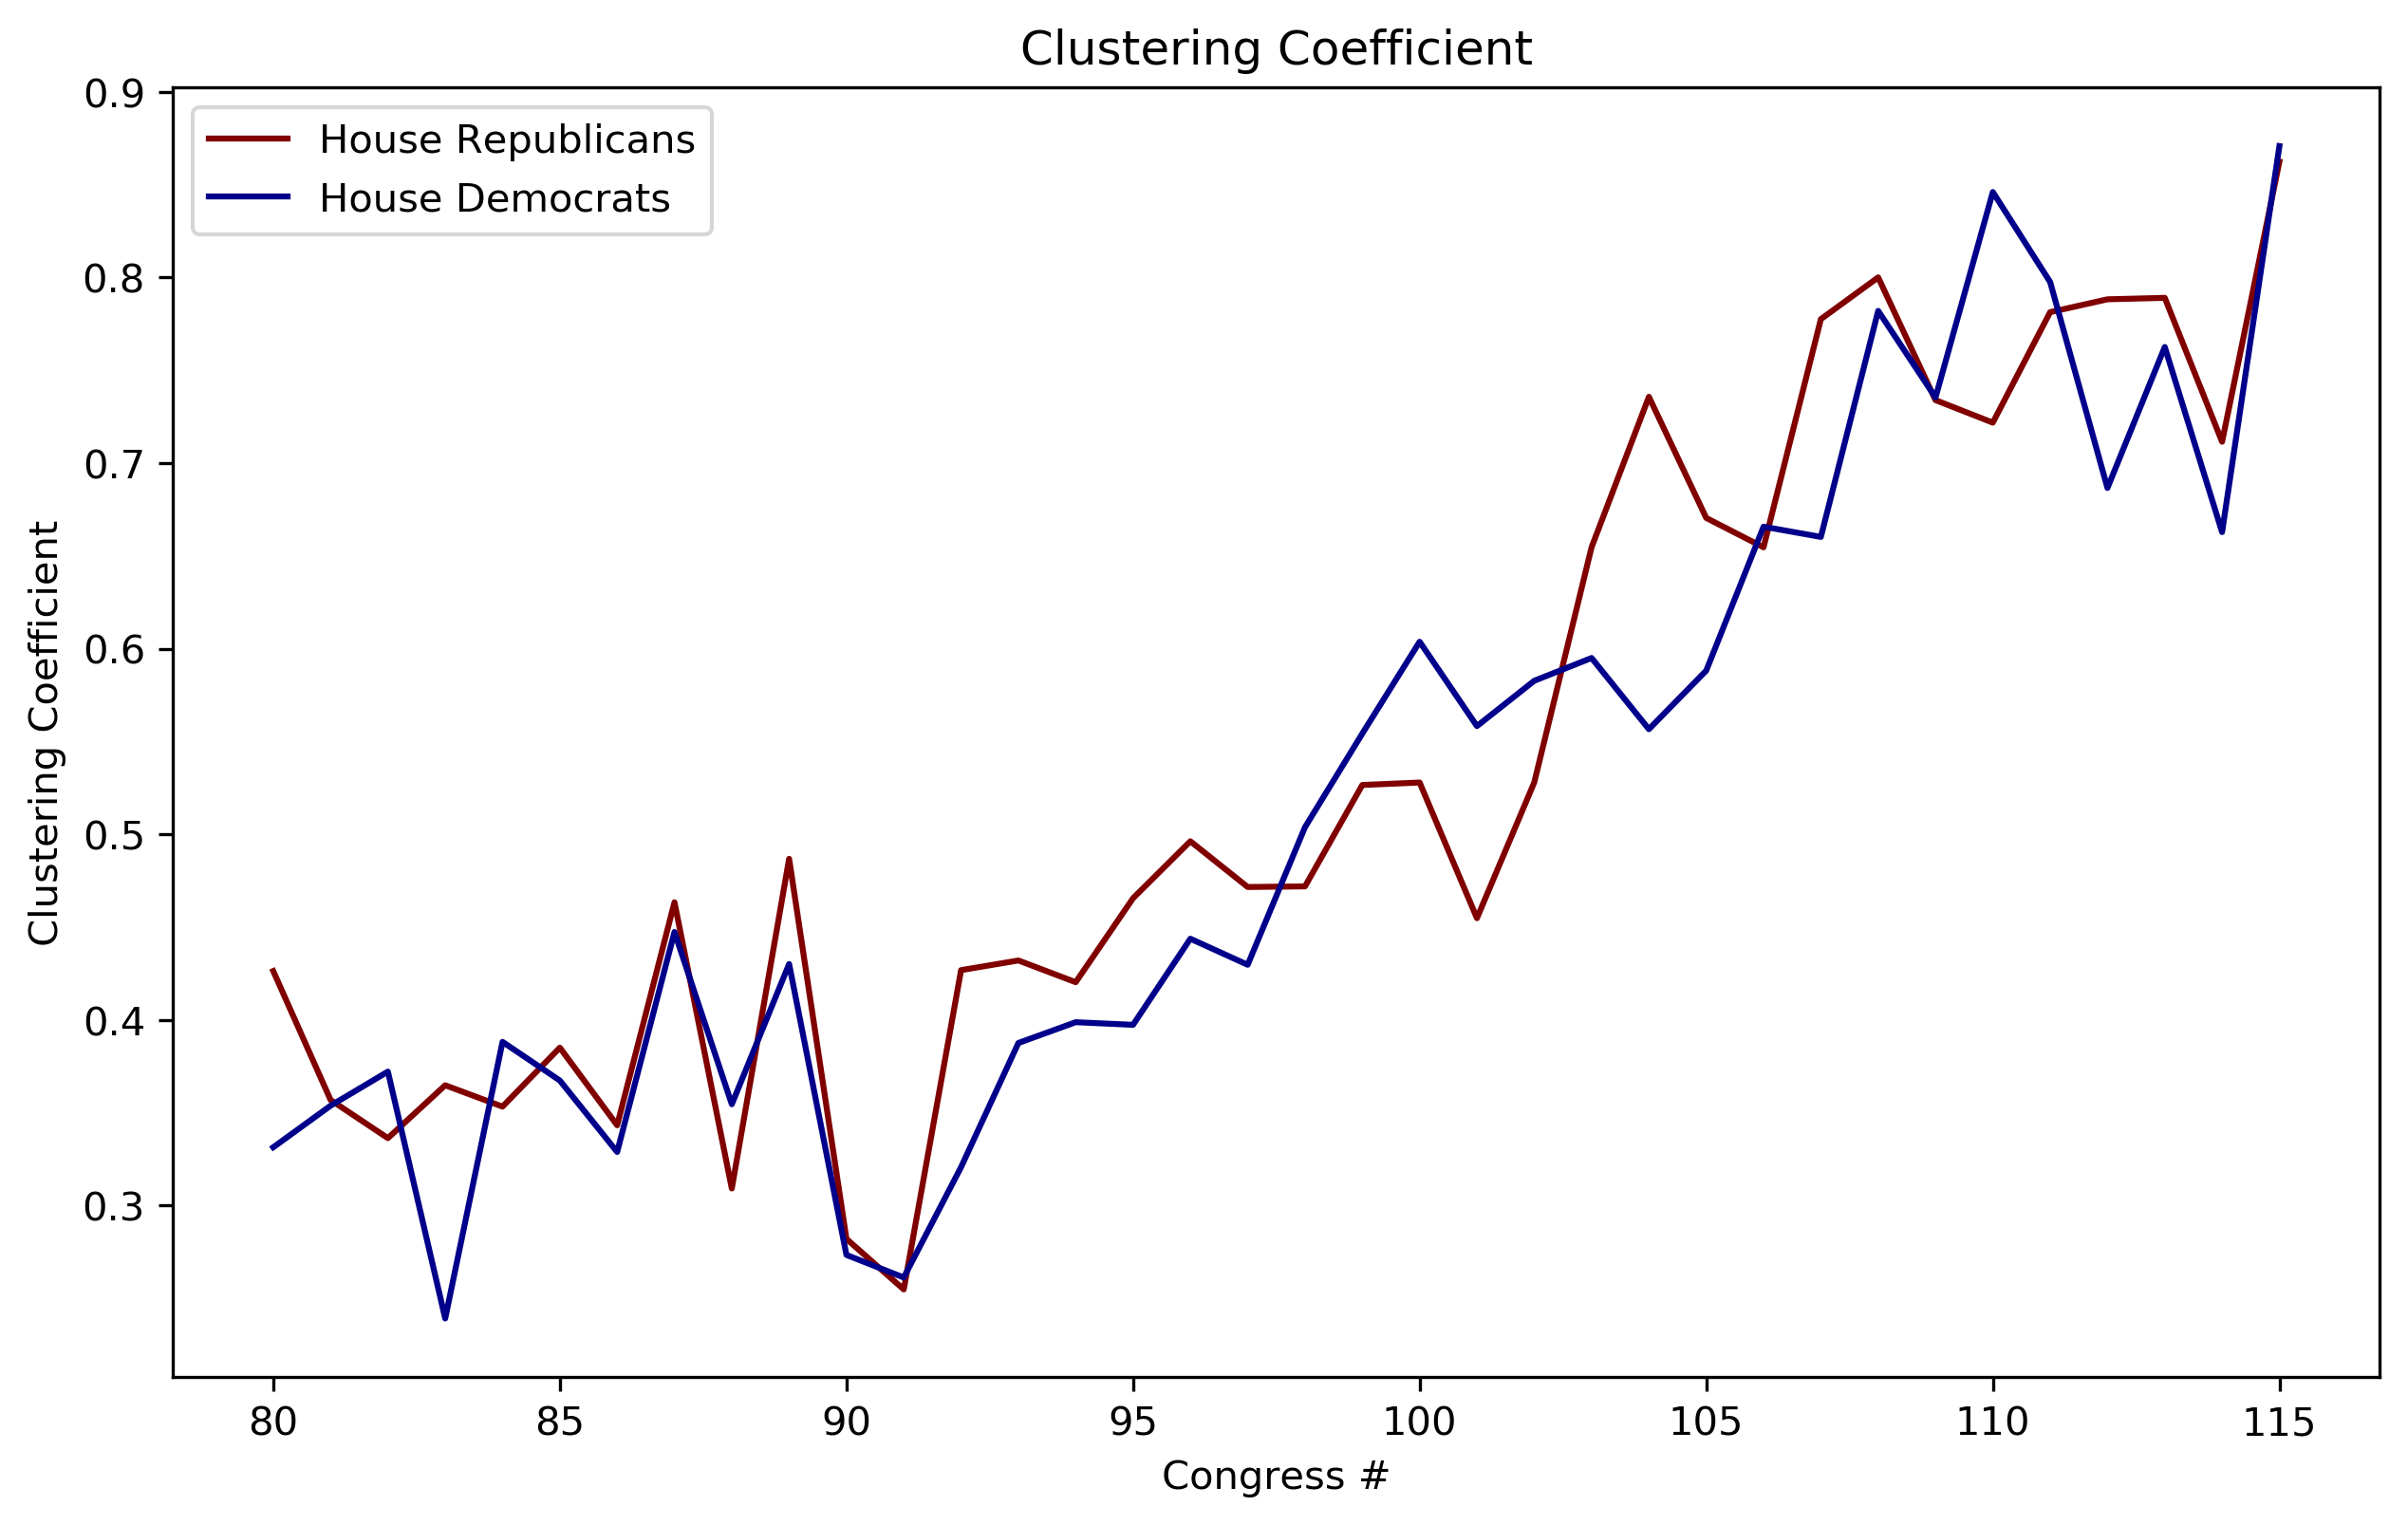
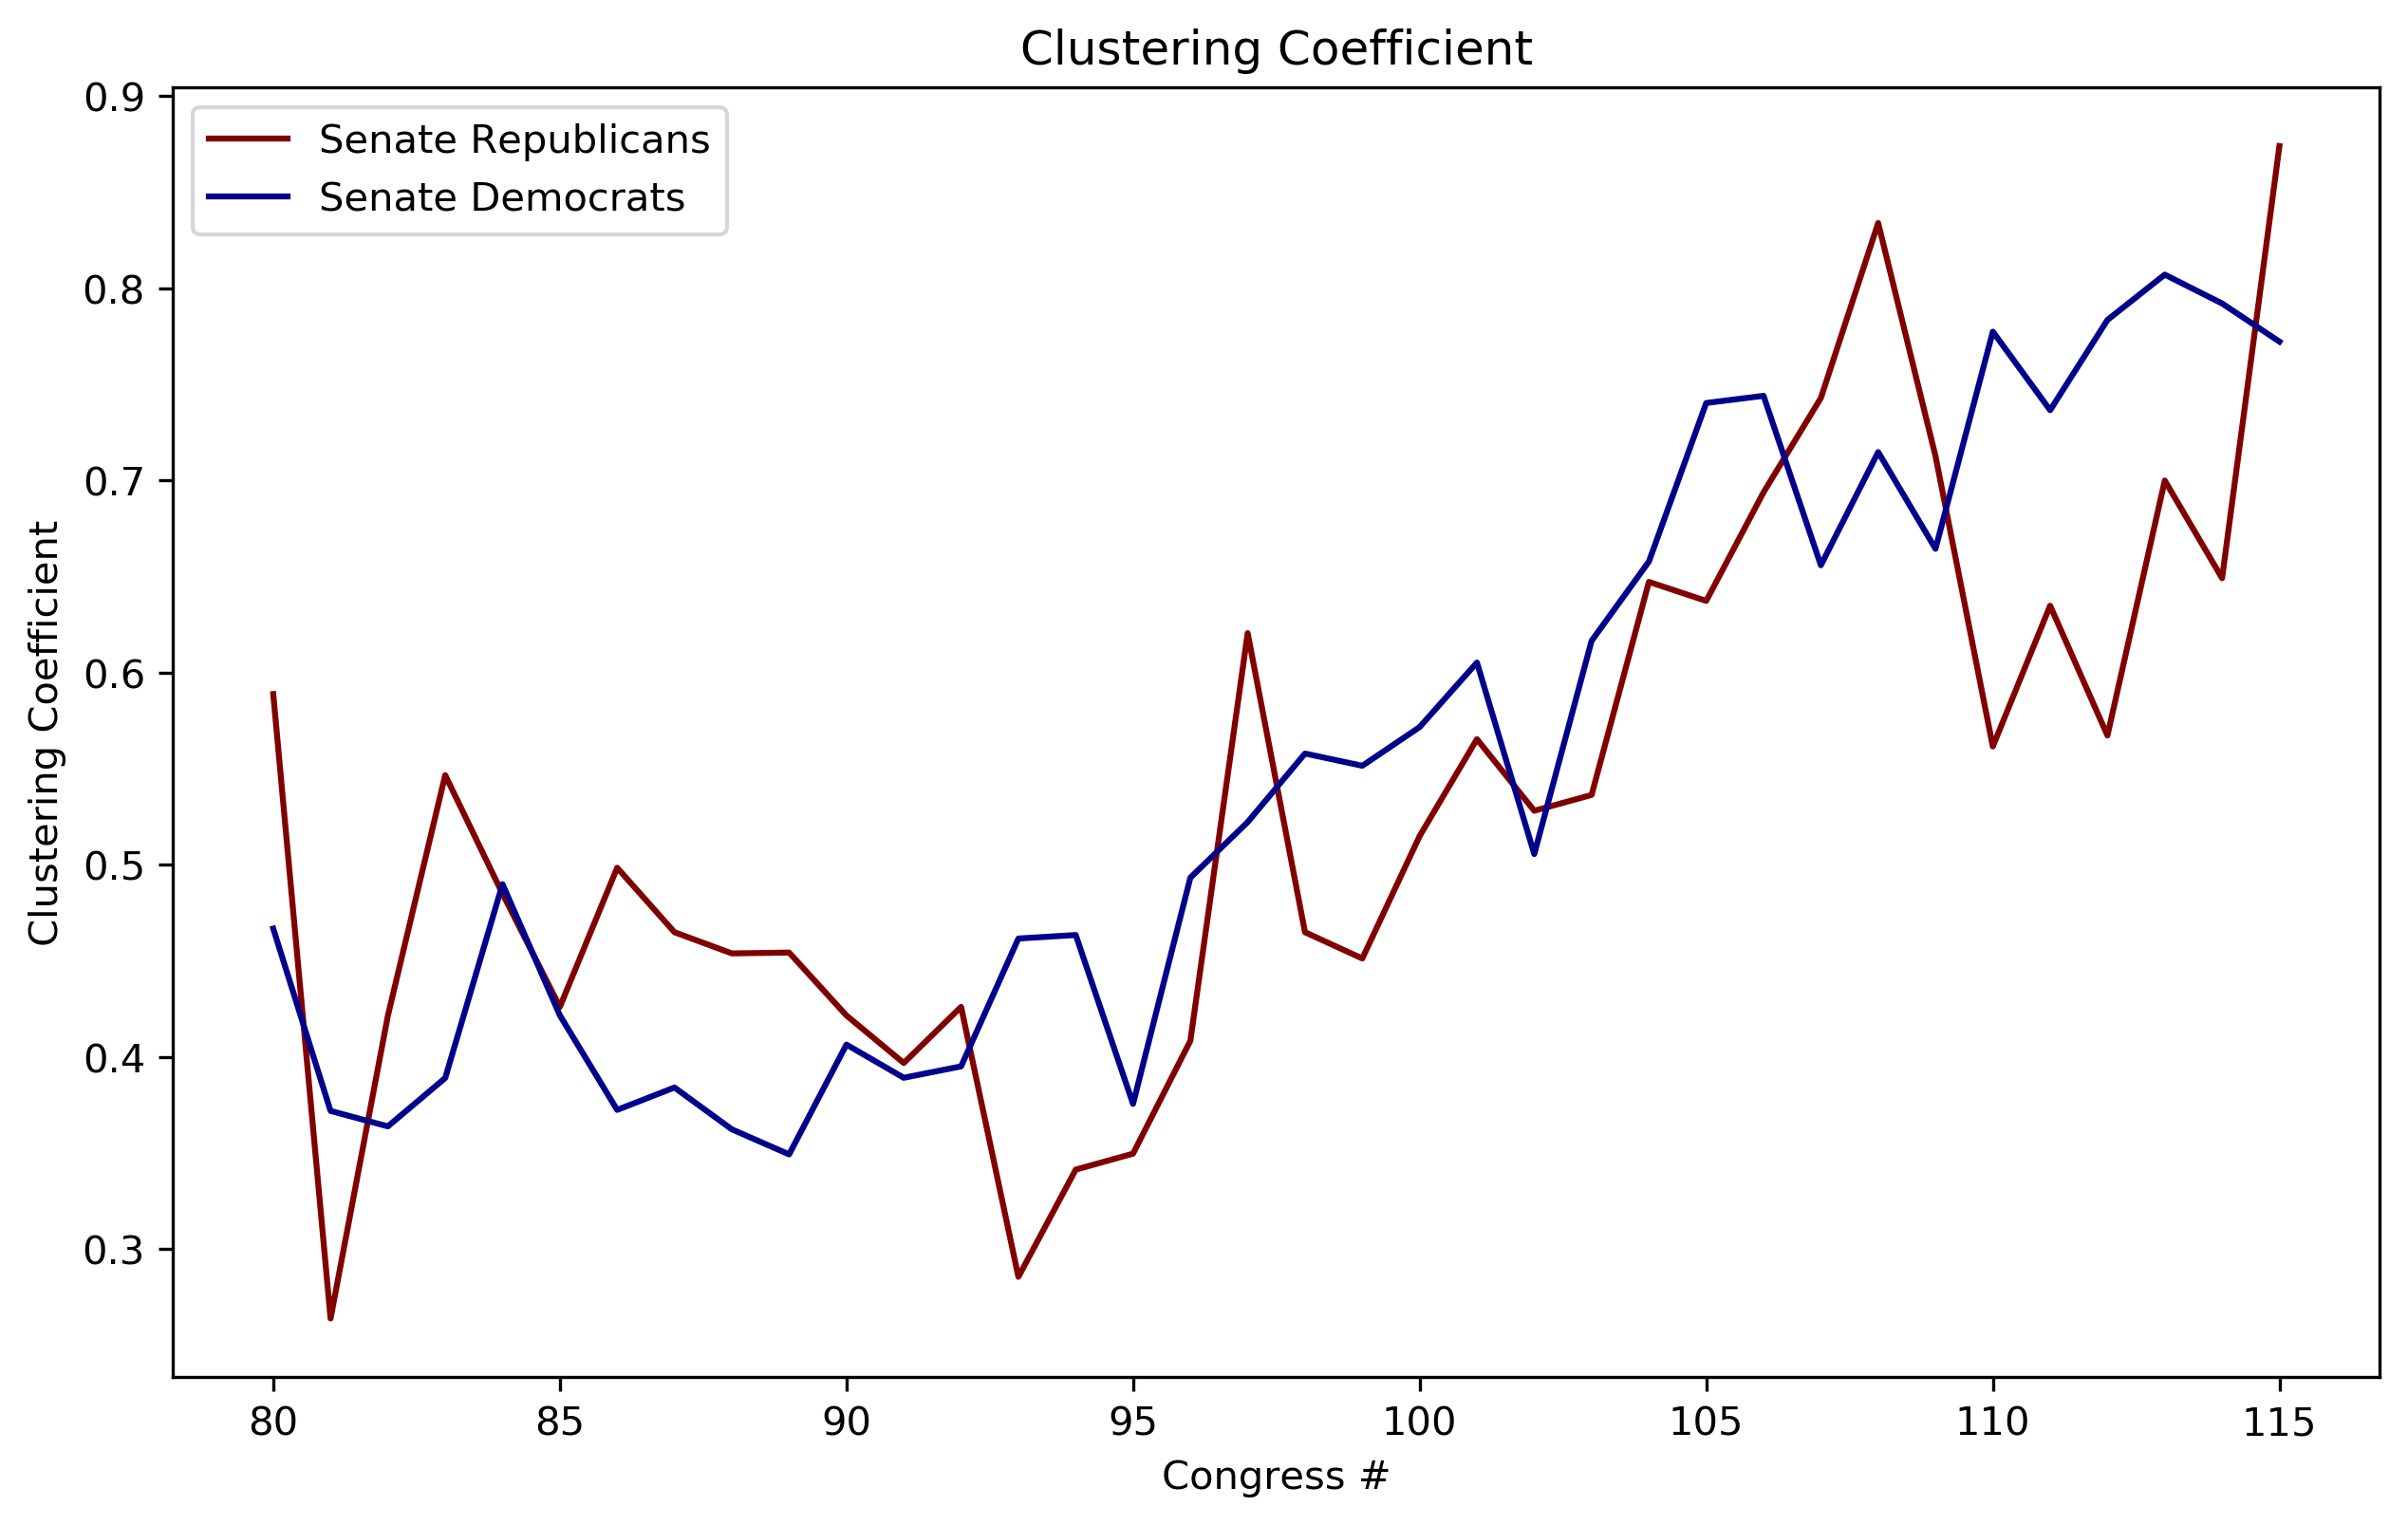
Clustering Coefficient
This looks at how tightly knit the parties are. It can be seen that they have gotten more tightly knit over the years especially during the appointment of Trum (115th Congress).
clust_rep = []
for i in range(80,116):
    clust_rep.append(nx.average_clustering(net[i].get_subgraph('senate', 'rep'), weight='cossim'))

clust_reph = []
for i in tqdm(range(80,116)):
    clust_reph.append(nx.average_clustering(net[i].get_subgraph('house', 'rep'), weight='cossim'))
clust_dem = []
for i in range(80,116):
    clust_dem.append(nx.average_clustering(net[i].get_subgraph('senate', 'dem'), weight='cossim'))

clust_demh = []
for i in tqdm(range(80,116)):
    clust_demh.append(nx.average_clustering(net[i].get_subgraph('house', 'dem'), weight='cossim'))
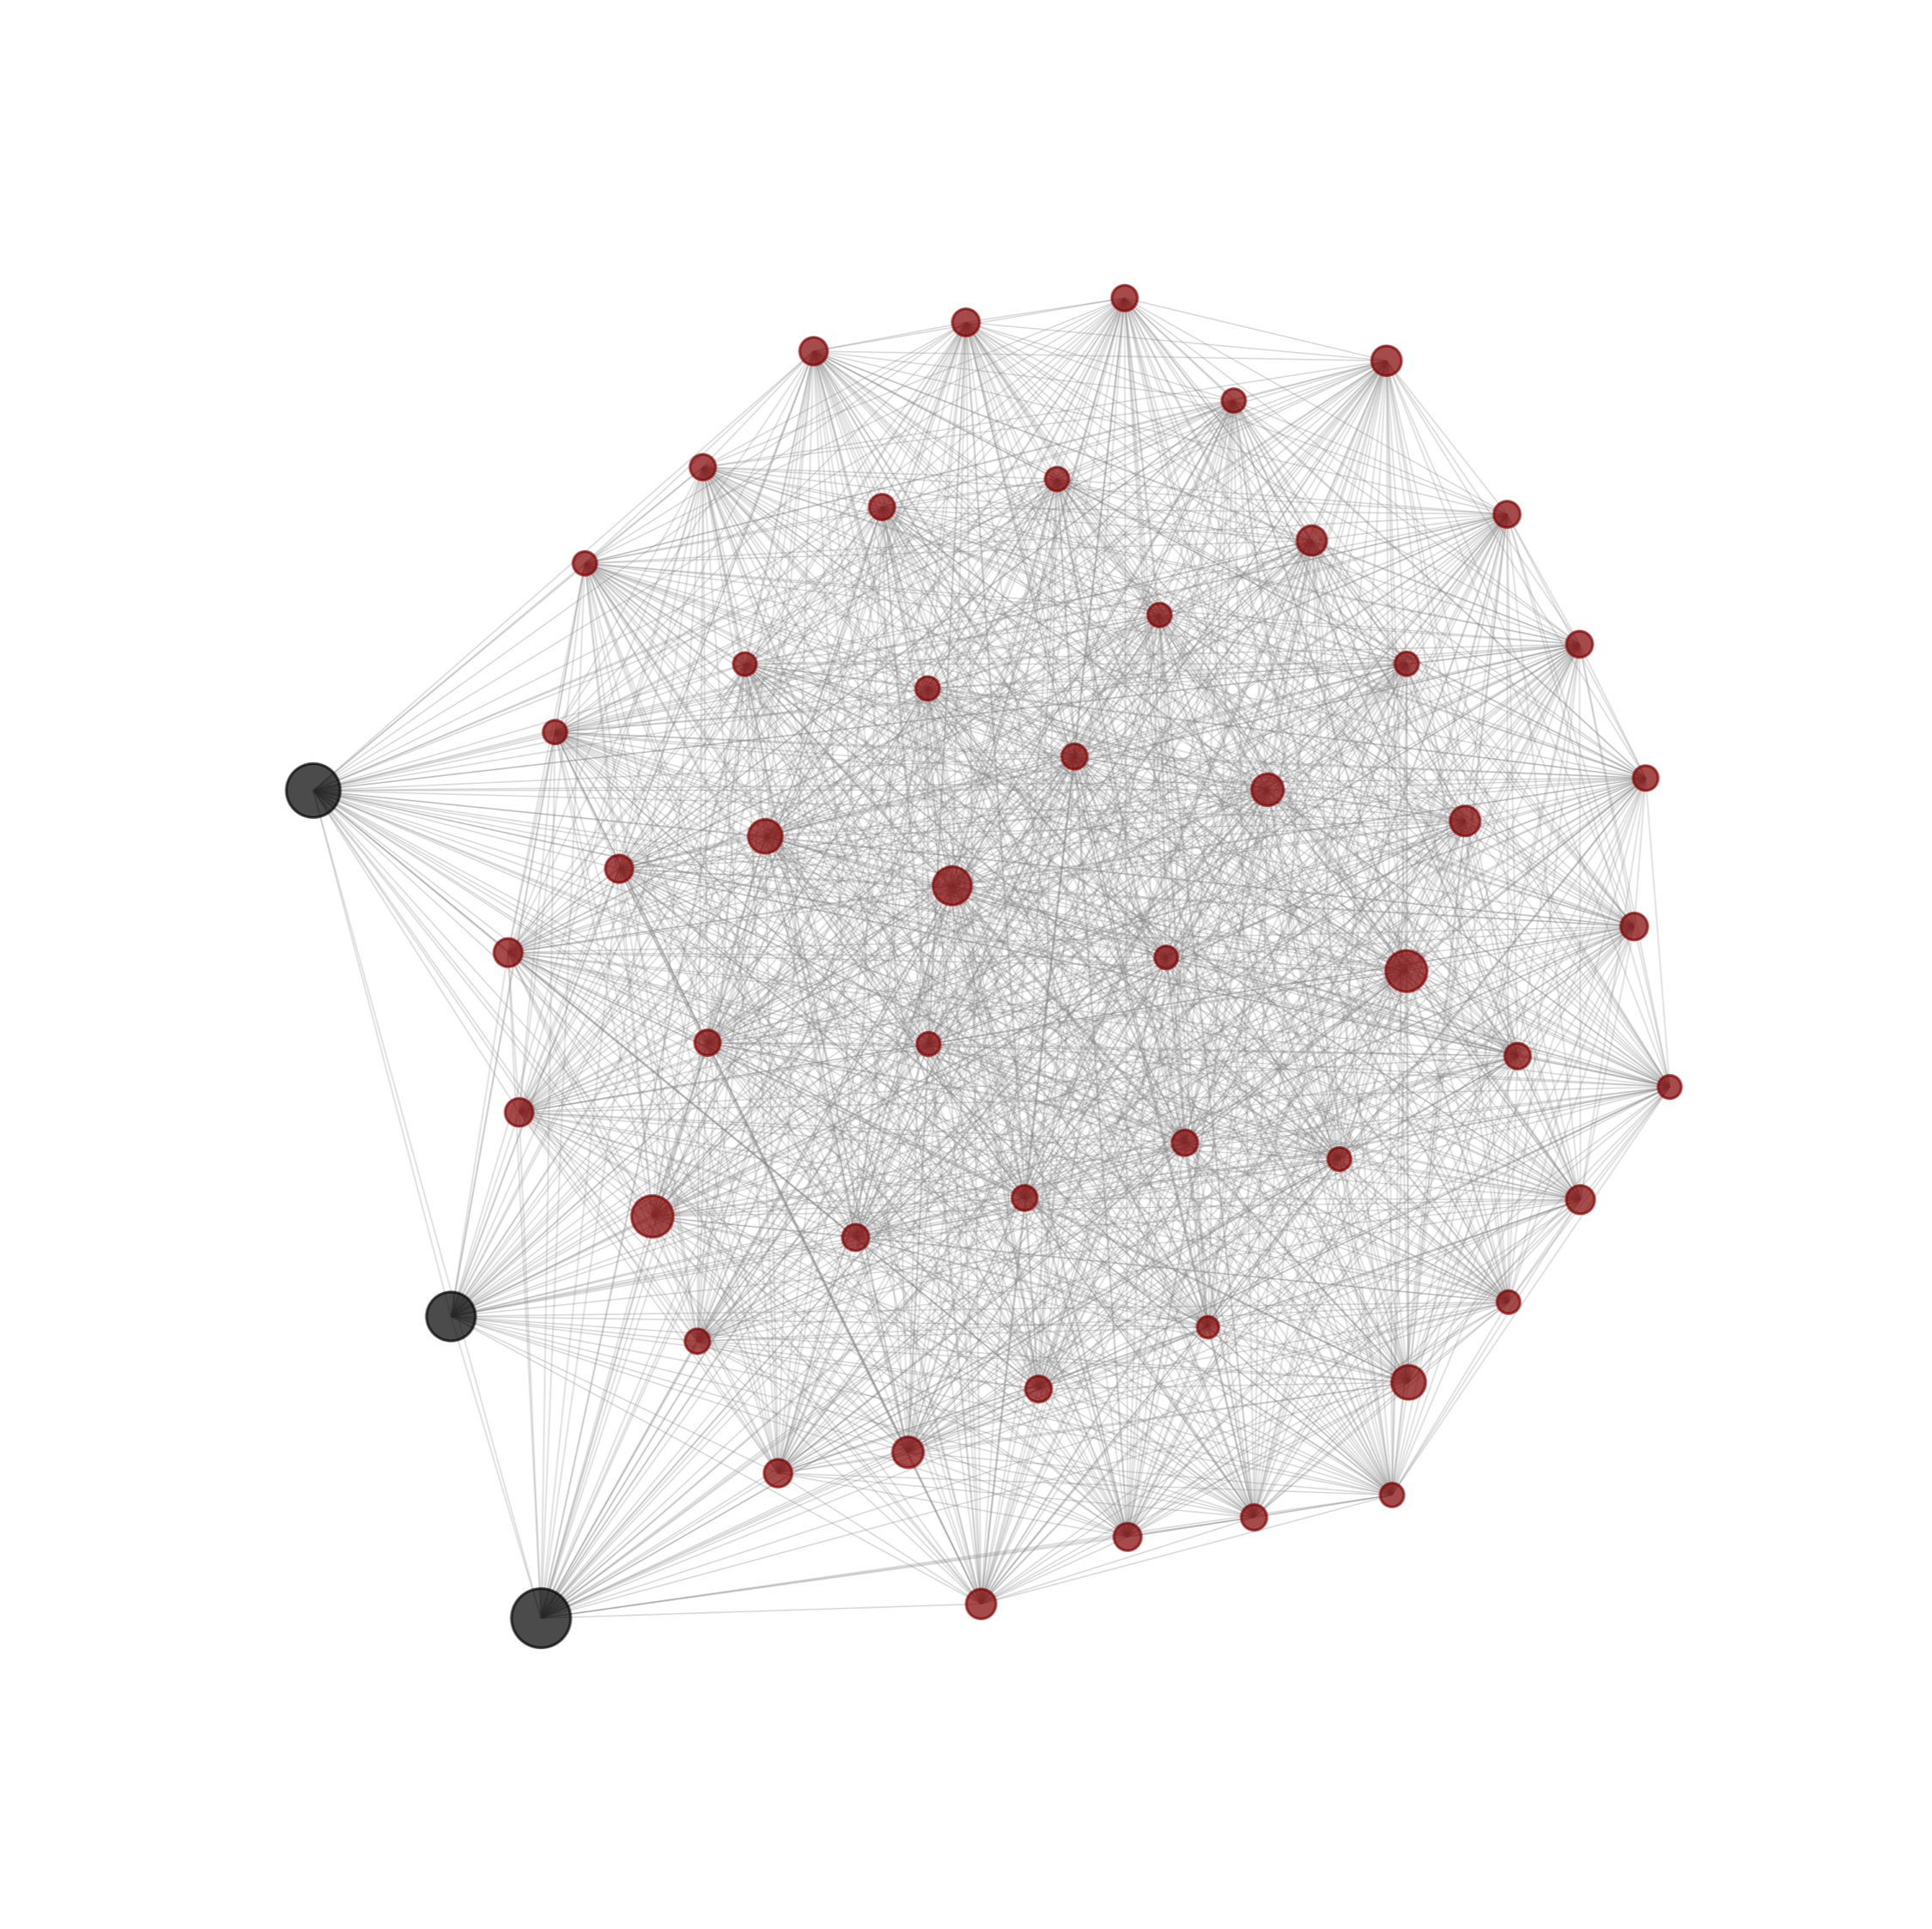
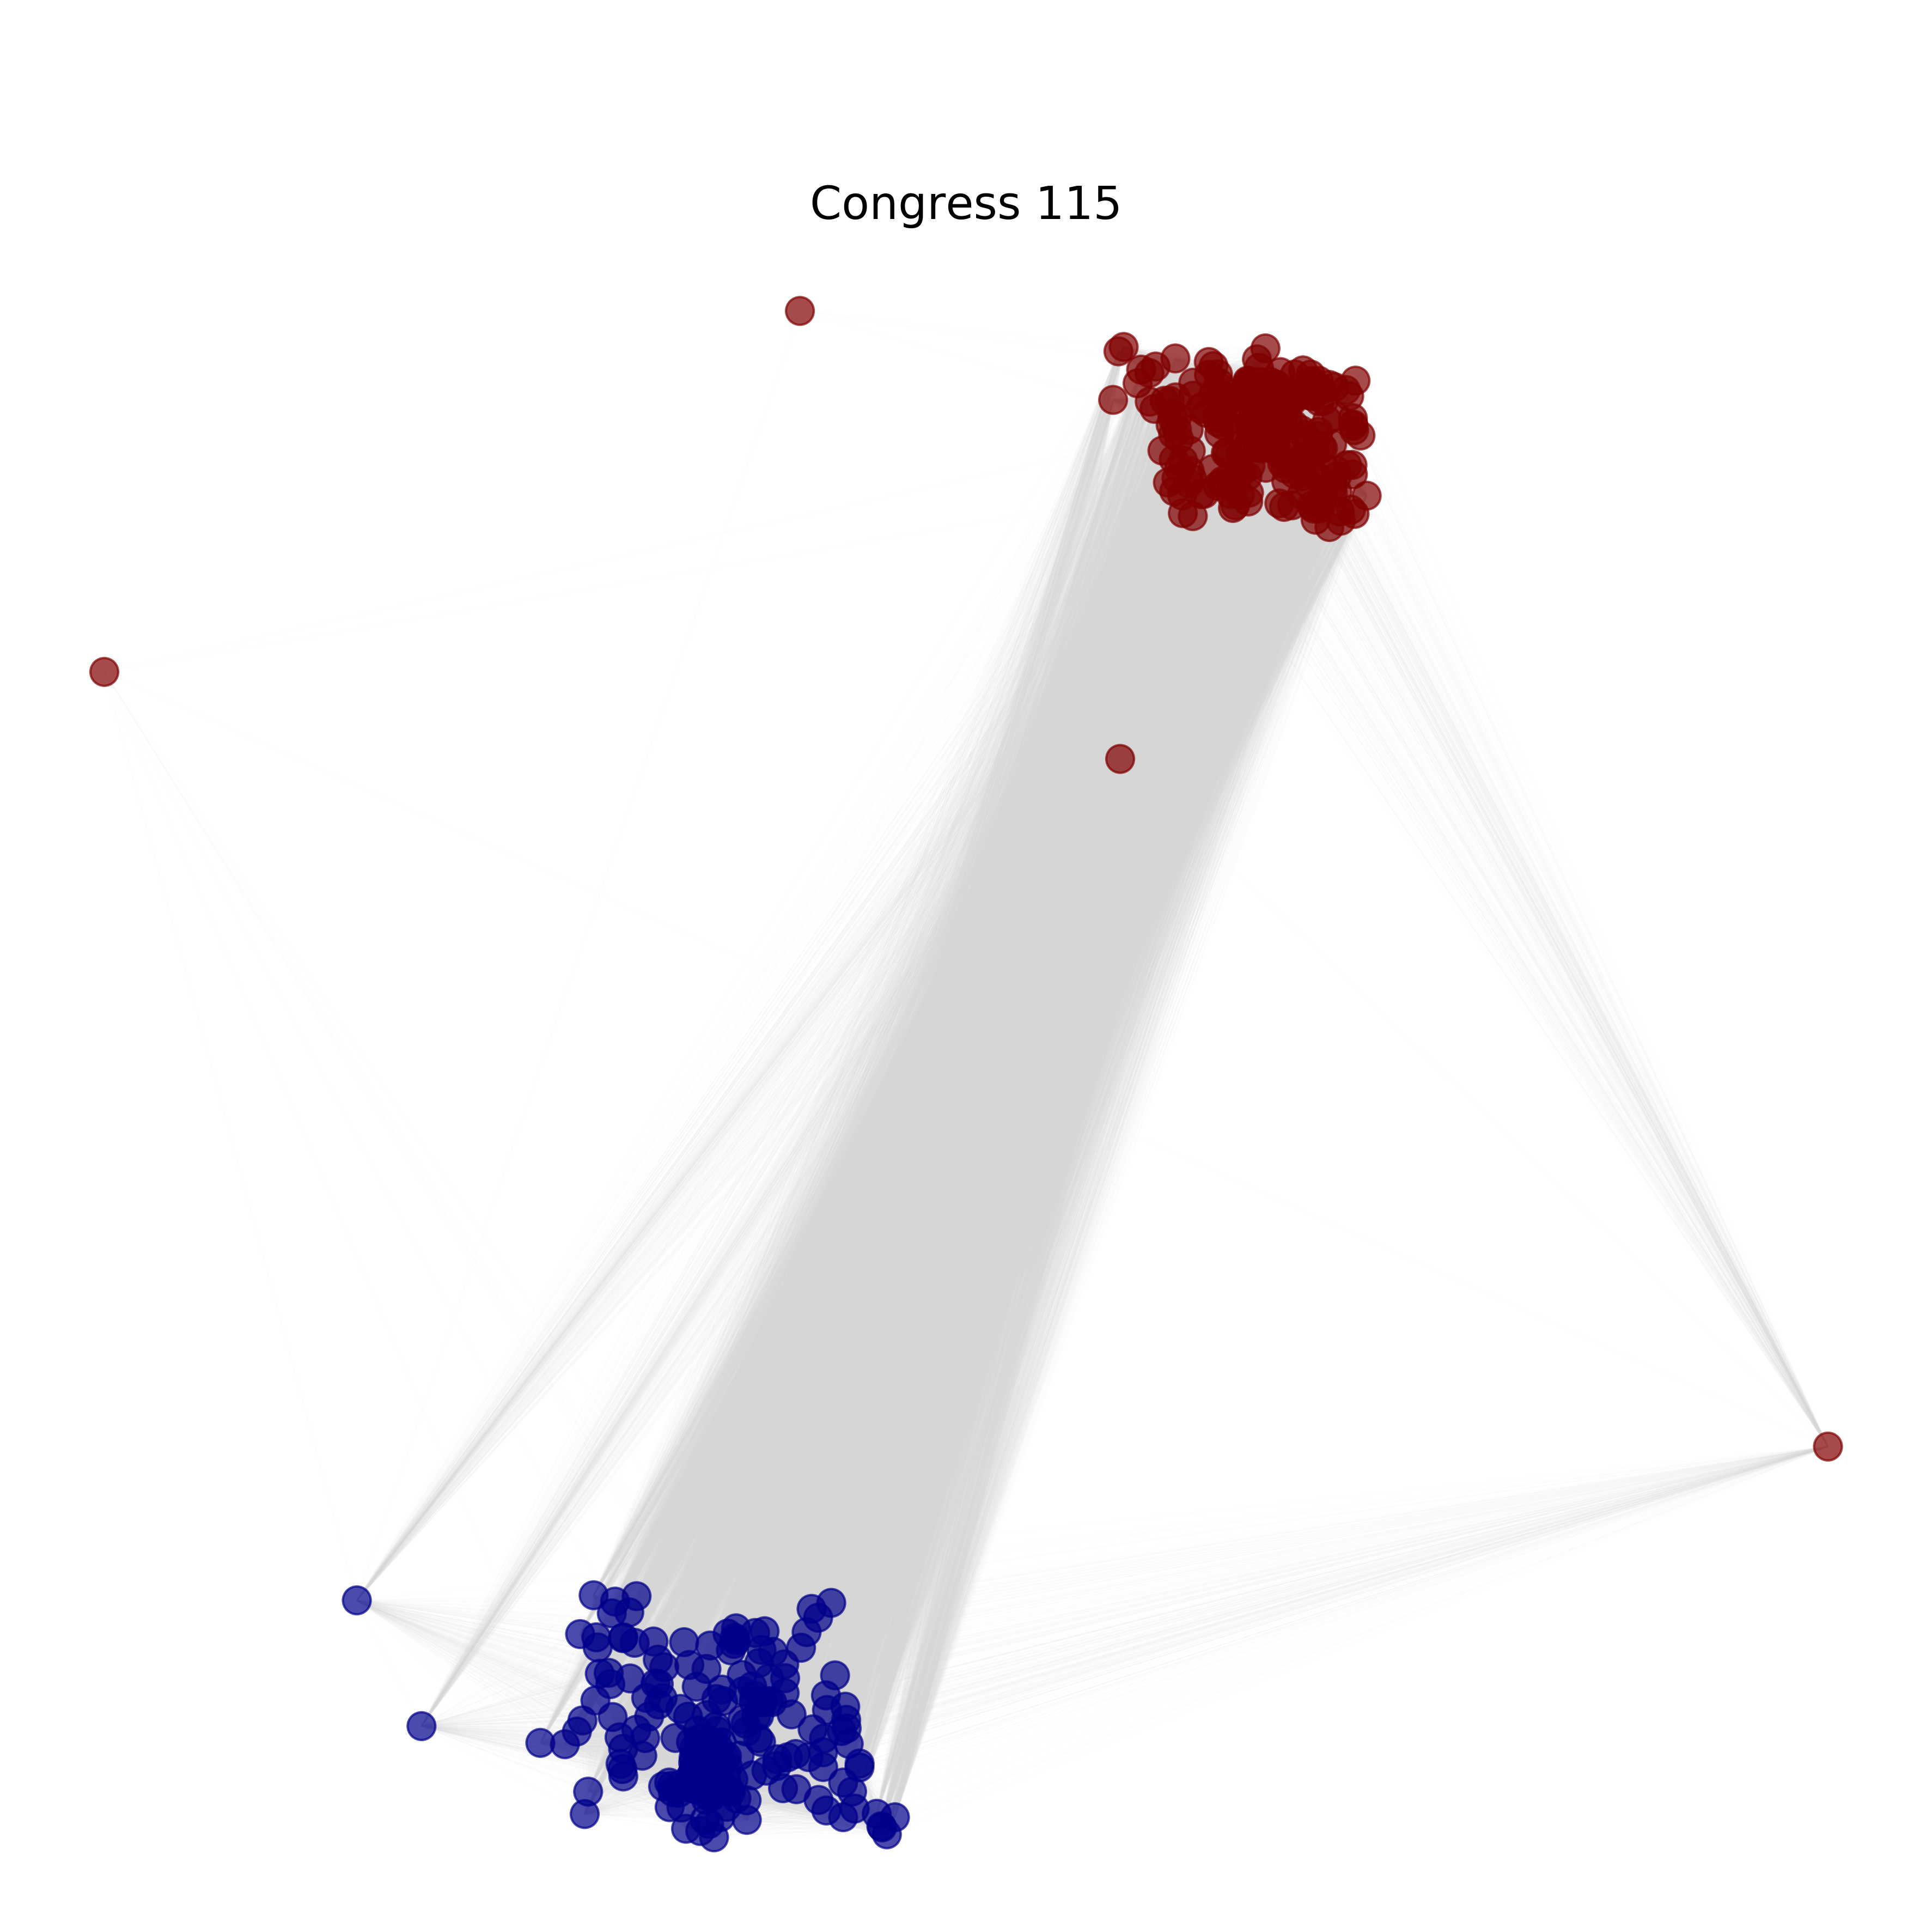
Network of the 115th House of Representatives
In the latest US Congress, this is what the representation of the House of Representatives looks like - very polarized. Edge lengths represent the cosine similarity between every member.
fig, ax = plt.subplots(2,1,dpi=300, figsize=(15,30))
weight = 'cossim'
pos2 = nx.fruchterman_reingold_layout(net[115].house, weight=weight)
ax[1].axis('off')
nx.draw_networkx_nodes(net[115].house, pos2, node_size=150, node_color=[net[115].house.node[i]['party_color'] if not net[115].house.node[i]['party_color'] \
                    not in ['darkblue', 'maroon']  else 'gray' for i in net[115].house.nodes], alpha=0.7, ax=ax[1]);
nx.draw_networkx_edges(net[115].house, pos2, alpha=0.05, edge_color='lightgray', width=0.5, ax=ax[1]);
ax[1].set_title('Congress 115', fontsize=20);
fig.savefig('Cong111vs115.png', transparent=True)
The evolution of the networks over time is shown below:
The Senate
House of Representatives
Conclusion
Our analysis shows that partisanship in both the House of Representatives and the Senate has intensified significantly over the past 72 years. Voting behavior of members are more likely influenced by political identity rather than by their distinctive view on the motions passed. The decisions members make could also be influenced by the ideological positions and charisma of their party leaders. The administration’s way of leadership and the president’s effectiveness at motivating or persuading partisans could be another factor. There are complex interactions that drive decision-making of these congress members and even though our data does not provide clear evidence on the association of these factors to partisanship, their effects are observable.
Research Paper Available
- The journal article for this study can be accessed here.
- This can also be viewed as a synthesized version with visual representations in this presentation deck.
Acknowledgements
This study was completed together with my project partner and co-author Kyle Ong.